PROTECTED SOURCE SCRIPT
업데이트됨 VWAP Bands
Orginal VWAP script is from neolao, so big thanks to him.
Took the VWAP, added the Bollinger and Keltner channel squeeze. Also there is a criteria of Bands width.
Great tool to predict fast large moves within short periods of time.
Tried to keep the charts as clean as possible and easy to read.
If there are any questions Ill be happy to help or answer them.
릴리즈 노트
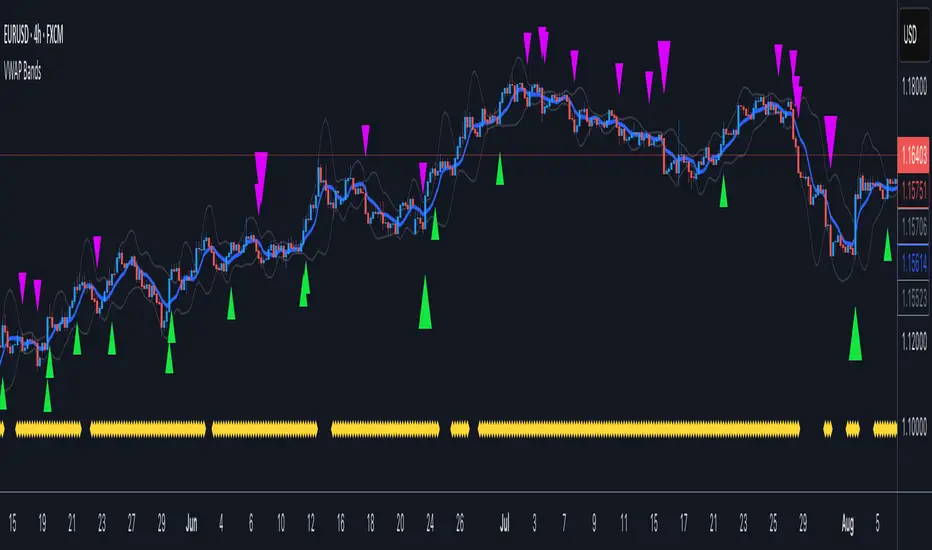
Fixed a small issue with the Keltner bands.Green triangles below represent a break upwards,
Purple triangles above represent a break downwards,
Yellow Diamonds as a Bollinger bands width.
릴리즈 노트
This script is used to display three technical indicators on a chart: VWAP, Bollinger Bands, and ATR Bands.Bollinger Bands are a technical analysis tool that uses two standard deviations from a simple moving average to create a range of likely price action. The Bollinger Bands consist of a center line (the simple moving average) and two price channels (the upper and lower bands). The width of the bands can be used as a measure of volatility. When the bands are narrow, it indicates that volatility is low, and when the bands are wide, it indicates that volatility is high.
ATR Bands use the Average True Range (ATR) indicator to create an upper and lower band around the price. The ATR measures the volatility of the security, and the bands adjust accordingly.
Traders and investors can use this script to identify potential buy and sell signals. For example, if the price is trading near the lower Bollinger Band and the ATR Bands are narrow, it could indicate that the security is oversold and that it's a good time to buy.
릴리즈 노트
**NEW FEATURES:**- Volume-based signal sizing - Larger triangles indicate higher volume conviction
- Customisable volume confirmation filters
- Full color customisation for all elements
- Optional compression visual controls (reduce chart noise)
- Enhanced alert conditions with volume categorization
**TECHNICAL IMPROVEMENTS:**
- Upgraded to Pine Script v6 for better performance
- Improved security() function calls with lookahead protection
- Organized input groups for better user experience
- Modern function syntax throughout
**HOW VOLUME SIZING WORKS:**
- Tiny signals = Normal volume (< 1.3x average)
- Small signals = Above average volume (1.3x - 2x average)
- Normal signals = High volume (2x+ average)
**USAGE:**
Same core signals (green/purple triangles) with added volume intelligence. Bigger signals = higher conviction trades based on volume participation. Use alert options to filter by volume strength.
보호된 스크립트입니다
이 스크립트는 비공개 소스로 게시됩니다. 하지만 이를 자유롭게 제한 없이 사용할 수 있습니다 – 자세한 내용은 여기에서 확인하세요.
면책사항
해당 정보와 게시물은 금융, 투자, 트레이딩 또는 기타 유형의 조언이나 권장 사항으로 간주되지 않으며, 트레이딩뷰에서 제공하거나 보증하는 것이 아닙니다. 자세한 내용은 이용 약관을 참조하세요.
면책사항
해당 정보와 게시물은 금융, 투자, 트레이딩 또는 기타 유형의 조언이나 권장 사항으로 간주되지 않으며, 트레이딩뷰에서 제공하거나 보증하는 것이 아닙니다. 자세한 내용은 이용 약관을 참조하세요.