OPEN-SOURCE SCRIPT
Expected SPX Movement by timeframe
THIS INDICATOR ONLY WORKS FOR  SPXCHART
This code will help you to measure the expected movement ofSPXin a previously selected timeframe based on the current value of VIX index
E.g. if the current value of VIX is 30 we calculate first the expected move of the next 12 months.
Once you have that calculation it it'll provide the range expressed as percentage of the expected move for the following period.
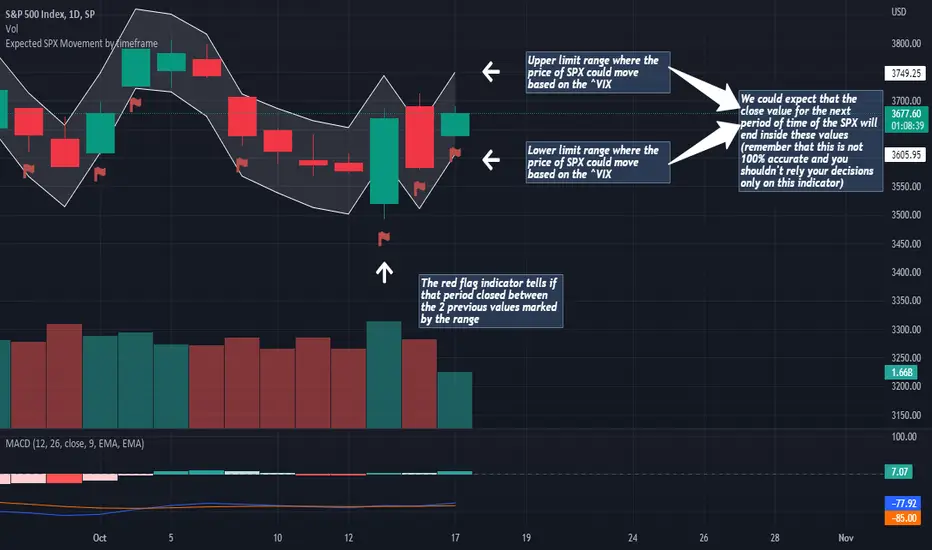
This script will plot that information in a range of 2 lines which represents the expected move of the SPX for the next period
The red flag indicator tells if that period closed between the 2 previous values marked by the range
This code will help you to measure the expected movement of
E.g. if the current value of VIX is 30 we calculate first the expected move of the next 12 months.
- If you selected the Daily timeframe it will calculate the expected move of SPX in the next Day by dividing the current VIX Value by the squared root of 252
(The 252 value corresponds to the approximate amount of trading sessions of the year)
If you selected the Weekly timeframe it will calculate the expected move of SPX in the next Week by dividing the current VIX Value by the squared root of 52
(The 52 value corresponds to the amount of weeks of the year)
If you selected the Monthly timeframe it will calculate the expected move of SPX in the next Week by dividing the current VIX Value by the squared root of 12
(The 12 value corresponds to the amount of months of the year)
For lower timeframes you have to calculate the amount of ticks in each trading session of the year in order to get that specific range
Once you have that calculation it it'll provide the range expressed as percentage of the expected move for the following period.
This script will plot that information in a range of 2 lines which represents the expected move of the SPX for the next period
The red flag indicator tells if that period closed between the 2 previous values marked by the range
오픈 소스 스크립트
트레이딩뷰의 진정한 정신에 따라, 이 스크립트의 작성자는 이를 오픈소스로 공개하여 트레이더들이 기능을 검토하고 검증할 수 있도록 했습니다. 작성자에게 찬사를 보냅니다! 이 코드는 무료로 사용할 수 있지만, 코드를 재게시하는 경우 하우스 룰이 적용된다는 점을 기억하세요.
면책사항
해당 정보와 게시물은 금융, 투자, 트레이딩 또는 기타 유형의 조언이나 권장 사항으로 간주되지 않으며, 트레이딩뷰에서 제공하거나 보증하는 것이 아닙니다. 자세한 내용은 이용 약관을 참조하세요.
오픈 소스 스크립트
트레이딩뷰의 진정한 정신에 따라, 이 스크립트의 작성자는 이를 오픈소스로 공개하여 트레이더들이 기능을 검토하고 검증할 수 있도록 했습니다. 작성자에게 찬사를 보냅니다! 이 코드는 무료로 사용할 수 있지만, 코드를 재게시하는 경우 하우스 룰이 적용된다는 점을 기억하세요.
면책사항
해당 정보와 게시물은 금융, 투자, 트레이딩 또는 기타 유형의 조언이나 권장 사항으로 간주되지 않으며, 트레이딩뷰에서 제공하거나 보증하는 것이 아닙니다. 자세한 내용은 이용 약관을 참조하세요.