OPEN-SOURCE SCRIPT
업데이트됨 MACD+RSI+Flag v2 by RM
This source code is subject to the terms of the Mozilla Public License 2.0 at mozilla.org/MPL/2.0/
There are a number of very clever people I have taken bits of code and ideas, thanks to you all :) © raul3429
investopedia.com/
RSI: The relative strength index (RSI) is a momentum indicator measures recent price changes to evaluate overbought or oversold conditions.
MACD: Moving average convergence divergence (MACD) is a trend-following momentum indicator that shows the relationship between two moving averages of a security’s price. The MACD is = 12EMA - 26EMA, The histogram represent this difference.
Notes:
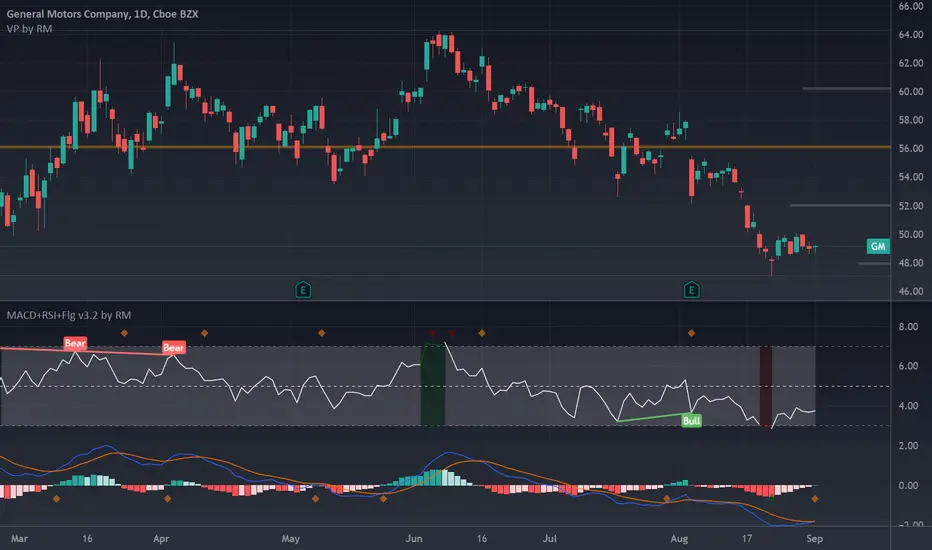
This code has Flags for first candle change during oversold/overbought shown as triangles, also and MACD 12 and MACD 26 crossings as diamonds. These are sometimes indicators of trend change.
RSI has been scaled down by "scaleRSI" parameter to enable plotting alongside MACD
Depending on the security being evaluated the RSI scale may need to be adjusted as the MACD ranges vary between symbols.
Disclaimer:
This is not a Financial advisory tool. For education purposes only. Use at your own risk.
There are a number of very clever people I have taken bits of code and ideas, thanks to you all :) © raul3429
investopedia.com/
RSI: The relative strength index (RSI) is a momentum indicator measures recent price changes to evaluate overbought or oversold conditions.
MACD: Moving average convergence divergence (MACD) is a trend-following momentum indicator that shows the relationship between two moving averages of a security’s price. The MACD is = 12EMA - 26EMA, The histogram represent this difference.
Notes:
This code has Flags for first candle change during oversold/overbought shown as triangles, also and MACD 12 and MACD 26 crossings as diamonds. These are sometimes indicators of trend change.
RSI has been scaled down by "scaleRSI" parameter to enable plotting alongside MACD
Depending on the security being evaluated the RSI scale may need to be adjusted as the MACD ranges vary between symbols.
Disclaimer:
This is not a Financial advisory tool. For education purposes only. Use at your own risk.
릴리즈 노트
This update (v3) has improved visibility of overbought/oversold conditions in the RSI chart component. This code has Flags for first candle change during oversold/overbought shown as triangles, also and MACD 12 and MACD 26 crossings as diamonds.
RSI has been scaled down by "scaleRSI" parameter to enable plotting alongside MACD. User may need to adjust Scale as required to shown RSI & MACD.
RSI: The relative strength index (RSI) is a momentum indicator measures recent price changes to evaluate overbought or oversold conditions.
MACD: Moving average convergence divergence (MACD) is a trend-following momentum indicator that shows the relationship between two moving averages of a security’s price. The MACD is = 12EMA - 26EMA, The histogram represent this difference.
Disclaimer: This is not a Financial advisory tool. For education purposes only. Use at your own risk.
릴리즈 노트
V3.2 Added Divergence indicator plus other minor changes (color definition, inclusion of color to indicator line and band, fixed scaling and improved explanations)오픈 소스 스크립트
트레이딩뷰의 진정한 정신에 따라, 이 스크립트의 작성자는 이를 오픈소스로 공개하여 트레이더들이 기능을 검토하고 검증할 수 있도록 했습니다. 작성자에게 찬사를 보냅니다! 이 코드는 무료로 사용할 수 있지만, 코드를 재게시하는 경우 하우스 룰이 적용된다는 점을 기억하세요.
면책사항
해당 정보와 게시물은 금융, 투자, 트레이딩 또는 기타 유형의 조언이나 권장 사항으로 간주되지 않으며, 트레이딩뷰에서 제공하거나 보증하는 것이 아닙니다. 자세한 내용은 이용 약관을 참조하세요.
오픈 소스 스크립트
트레이딩뷰의 진정한 정신에 따라, 이 스크립트의 작성자는 이를 오픈소스로 공개하여 트레이더들이 기능을 검토하고 검증할 수 있도록 했습니다. 작성자에게 찬사를 보냅니다! 이 코드는 무료로 사용할 수 있지만, 코드를 재게시하는 경우 하우스 룰이 적용된다는 점을 기억하세요.
면책사항
해당 정보와 게시물은 금융, 투자, 트레이딩 또는 기타 유형의 조언이나 권장 사항으로 간주되지 않으며, 트레이딩뷰에서 제공하거나 보증하는 것이 아닙니다. 자세한 내용은 이용 약관을 참조하세요.