OPEN-SOURCE SCRIPT
업데이트됨 Quarter Strength Table (3M) [CHE]
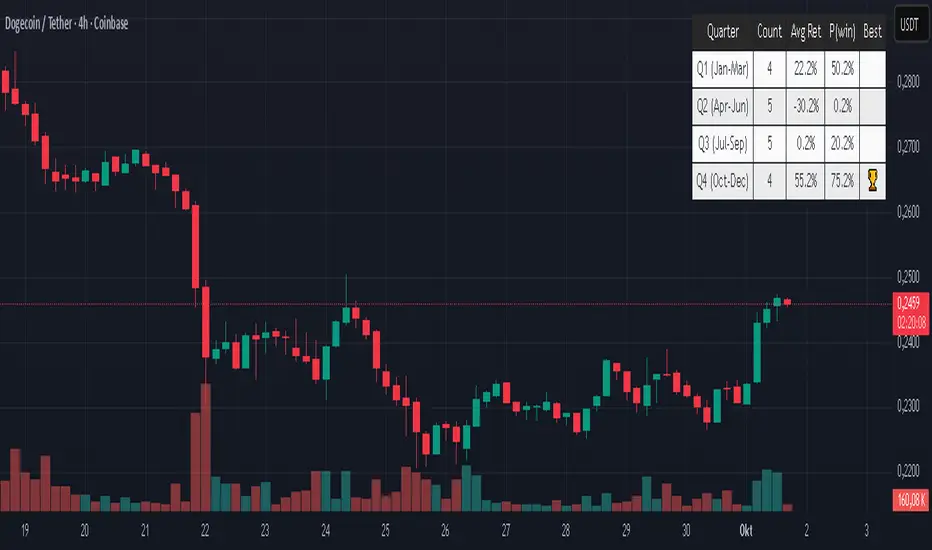
Quarter Strength Table (3M) — quarterly seasonality overview for the current symbol
Is there seasonality in certain assets? Some YouTubers claim there is—can you test it yourself?
Summary
This indicator builds a compact table that summarizes quarterly seasonality from three-month bars. It aggregates the simple return of each historical quarter, counts observations, computes the average return and the win rate for each quarter, and flags the historically strongest quarter. The output is a five-column table rendered on the chart, designed for quick comparison rather than signal generation. Because it processes only confirmed higher-timeframe bars, results are stable once a quarter has closed.
Motivation: Why this design?
Seasonality tools often mix intraperiod estimates with live bars, which can lead to misleading flips and inconsistent statistics. The core idea here is to restrict aggregation to completed three-month bars only and to deduplicate events by timestamp. This avoids partial information and double counting, so the table reflects a consistent, closed-bar history.
What’s different vs. standard approaches?
Baseline: Typical seasonality studies that compute monthly or quarterly stats directly on the chart timeframe or update on live higher-timeframe bars.
Architecture differences:
Uses explicit higher-timeframe requests for open, close, time, and calendar month from three-month bars.
Confirms the higher-timeframe bar before recording a sample; deduplicates by the higher-timeframe timestamp.
Keeps fixed arrays of length four for the four quarters; renders a fixed five-by-five table with zebra rows.
Practical effect: Once a quarter closes, counts and averages are stable. The “Best” column marks the highest average quarter so you can quickly identify the historically strongest period.
How it works (technical)
On every chart bar, the script requests three-month open, close, time, and the calendar month derived from that bar’s time. When the three-month bar is confirmed, it computes the simple return for that bar and maps the month to a quarter index between zero and three. A guard stores the last seen three-month timestamp to avoid duplicate writes. Per quarter, it accumulates the sum of returns, the number of samples, and the number of positive samples. From these, it derives average return and win rate. The table header is created once on the first bar; content updates only on the last visible chart bar for efficiency. No forward references are used, and lookahead is disabled in all higher-timeframe requests to avoid peeking.
Parameter Guide
Percent — Formats values as percentages. Default: true. Trade-off: Easier visual comparison; disable if you prefer raw unit returns.
Decimals — Number of digits shown. Default: two. Bounds: zero to six. Trade-off: More digits improve precision but reduce readability.
Show table — Toggles table rendering. Default: true. Trade-off: Disable when space is limited or for batch testing.
Reading & Interpretation
The table shows rows for Q1 through Q4 and columns for Count, Avg Ret, P(win), and Best.
Count: Number of completed three-month bars observed for that quarter.
Avg Ret: Average simple return across all samples in that quarter.
P(win): Share of samples with a positive return.
Best: An asterisk marks the quarter with the highest average return among those with at least one sample.
Use the combination of average and win rate to judge both magnitude and consistency. Low counts signal limited evidence.
Practical Workflows & Combinations
Trend following filter: Favor setups when the upcoming or active quarter historically shows a positive average and a stable win rate. Combine with structure analysis such as higher highs and higher lows to avoid fighting dominant trends.
Exits and risk: When entering during a historically weak quarter, consider tighter risk controls and quicker profit taking.
Multi-asset and multi-timeframe: The default settings work across most liquid symbols. For assets with sparse history, treat results as low confidence due to small sample sizes.
Behavior, Constraints & Performance
Repaint and confirmation: Aggregation occurs only when the three-month bar is confirmed; values do not change afterward for that bar. During an open quarter, no new sample is added.
Higher-timeframe usage: All higher-timeframe requests disable lookahead and rely on confirmation to mitigate repaint.
Resources: Declared `max_bars_back` is two thousand. Arrays are fixed at length four. The script updates the table only on the last visible bar to reduce work.
Known limits: Averages can be affected by outliers and structural market changes. Limited history reduces reliability. Corporate actions and contract rolls may influence returns depending on the symbol’s data source. This is a visualization and not a trading system.
Sensible Defaults & Quick Tuning
Starting values: Percent true; Decimals two; Show table true.
If numbers feel noisy: Decrease decimals to one to reduce visual clutter.
If you need raw values: Turn off Percent to display unit returns.
If the table overlaps price: Toggle Show table off when annotating, or reposition via your chart’s table controls.
What this indicator is—and isn’t
This is a historical summary of quarterly behavior. It visualizes evidence and helps frame expectations. It is not predictive, does not generate trade signals, and does not manage positions or risk. Always combine with market structure, liquidity considerations, and independent risk controls.
Inputs with defaults
Percent: true, boolean.
Decimals: two, integer between zero and six.
Show table: true, boolean.
Pine version: v6
Overlay: true
Primary outputs: Table with five columns and five rows.
Metrics/functions used: Higher-timeframe data requests, table rendering, arrays, bar state checks, month mapping.
Special techniques: Closed-bar aggregation, deduplication by higher-timeframe timestamp, zebra row styling.
Performance/constraints: Two thousand bars back, small fixed loops, higher-timeframe requests without lookahead.
Compatibility/assets/timeframes: Works on time-based charts across most assets with sufficient history.
Limitations/risks: Sample size sensitivity, regime shifts, data differences across venues.
Debug/diagnostics: (Unknown/Optional)
Disclaimer
The content provided, including all code and materials, is strictly for educational and informational purposes only. It is not intended as, and should not be interpreted as, financial advice, a recommendation to buy or sell any financial instrument, or an offer of any financial product or service. All strategies, tools, and examples discussed are provided for illustrative purposes to demonstrate coding techniques and the functionality of Pine Script within a trading context.
Any results from strategies or tools provided are hypothetical, and past performance is not indicative of future results. Trading and investing involve high risk, including the potential loss of principal, and may not be suitable for all individuals. Before making any trading decisions, please consult with a qualified financial professional to understand the risks involved.
By using this script, you acknowledge and agree that any trading decisions are made solely at your discretion and risk.
Do not use this indicator on Heikin-Ashi, Renko, Kagi, Point-and-Figure, or Range charts, as these chart types can produce unrealistic results for signal markers and alerts.
Best regards and happy trading
Chervolino
릴리즈 노트
Bug fix in Best오픈 소스 스크립트
트레이딩뷰의 진정한 정신에 따라, 이 스크립트의 작성자는 이를 오픈소스로 공개하여 트레이더들이 기능을 검토하고 검증할 수 있도록 했습니다. 작성자에게 찬사를 보냅니다! 이 코드는 무료로 사용할 수 있지만, 코드를 재게시하는 경우 하우스 룰이 적용된다는 점을 기억하세요.
면책사항
해당 정보와 게시물은 금융, 투자, 트레이딩 또는 기타 유형의 조언이나 권장 사항으로 간주되지 않으며, 트레이딩뷰에서 제공하거나 보증하는 것이 아닙니다. 자세한 내용은 이용 약관을 참조하세요.
오픈 소스 스크립트
트레이딩뷰의 진정한 정신에 따라, 이 스크립트의 작성자는 이를 오픈소스로 공개하여 트레이더들이 기능을 검토하고 검증할 수 있도록 했습니다. 작성자에게 찬사를 보냅니다! 이 코드는 무료로 사용할 수 있지만, 코드를 재게시하는 경우 하우스 룰이 적용된다는 점을 기억하세요.
면책사항
해당 정보와 게시물은 금융, 투자, 트레이딩 또는 기타 유형의 조언이나 권장 사항으로 간주되지 않으며, 트레이딩뷰에서 제공하거나 보증하는 것이 아닙니다. 자세한 내용은 이용 약관을 참조하세요.