OPEN-SOURCE SCRIPT
Strong Trend Candles
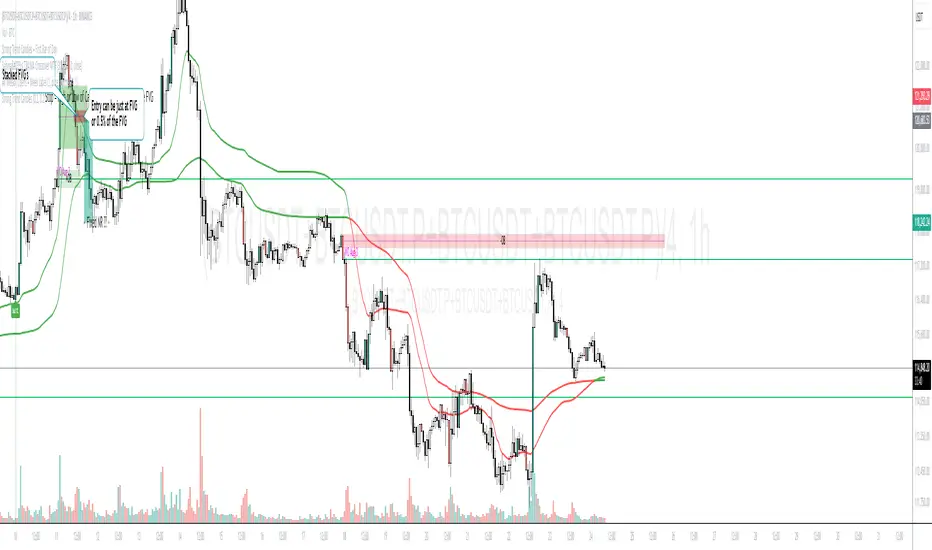
This indicator highlights trend candles using a mathematically grounded method designed to identify moments when the market is truly dominated by buyers or sellers
Up-Trend Candle (UP):
The open is close to the session’s low.
The close is close to the session’s high.
This structure reflects sustained bullish control from start to finish.
Down-Trend Candle (DOWN):
The open is near the high.
The close is near the low.
This reflects clear bearish control throughout the session.
Precise Definitions Used:
UP-Trend Candle:
Open ≤ Low + 10% of range
Close ≥ High - 20% of range
DOWN-Trend Candle:
Open ≥ High - 10% of range
Close ≤ Low + 20% of range
Here, the range is simply High - Low.
Why are the thresholds different (10% vs 20%)?
This is intentional and based on how markets behave:
The opening price tends to be precise and stable in trend days. A strong trending candle usually opens very close to one end (high or low), reflecting a clean start without hesitation.
The closing price, however, often pulls back slightly before the end of the session—even during strong trends—due to profit-taking or last-minute volatility.
That’s why the close is allowed more tolerance (20%), while the open is held to a stricter threshold (10%). This balance allows the indicator to be strict enough to filter noise, yet flexible enough to capture real trends.
✅ Why this is useful
Unlike vague candle patterns like "bullish engulfing" or "marubozu," this method focuses strictly on structure and positioning, not color or subjective shape. It isolates the candles where one side clearly dominated, offering cleaner entries for breakout, continuation, or confirmation strategies.
You can use this tool to:
Spot high-momentum price action
Confirm breakouts or directional bias
Filter setups based on strong market conviction
🔹 How it works
An Up-Trend Candle is detected when the open is close to the daily low and the close is close to the daily high.
A Down-Trend Candle is detected when the open is close to the daily high and the close is close to the daily low.
The thresholds for “close to high/low” are configurable through the Open % of Range and Close % of Range inputs.
🔹 How to use it
Candles are colored according to their classification.
Colors can be customized in the settings.
This tool can be applied in any timeframe.
⚠️ Notes:
This script does not generate buy/sell signals.
It is designed to help visualize strong candles based on intraday range conditions.
오픈 소스 스크립트
트레이딩뷰의 진정한 정신에 따라, 이 스크립트의 작성자는 이를 오픈소스로 공개하여 트레이더들이 기능을 검토하고 검증할 수 있도록 했습니다. 작성자에게 찬사를 보냅니다! 이 코드는 무료로 사용할 수 있지만, 코드를 재게시하는 경우 하우스 룰이 적용된다는 점을 기억하세요.
면책사항
해당 정보와 게시물은 금융, 투자, 트레이딩 또는 기타 유형의 조언이나 권장 사항으로 간주되지 않으며, 트레이딩뷰에서 제공하거나 보증하는 것이 아닙니다. 자세한 내용은 이용 약관을 참조하세요.
오픈 소스 스크립트
트레이딩뷰의 진정한 정신에 따라, 이 스크립트의 작성자는 이를 오픈소스로 공개하여 트레이더들이 기능을 검토하고 검증할 수 있도록 했습니다. 작성자에게 찬사를 보냅니다! 이 코드는 무료로 사용할 수 있지만, 코드를 재게시하는 경우 하우스 룰이 적용된다는 점을 기억하세요.
면책사항
해당 정보와 게시물은 금융, 투자, 트레이딩 또는 기타 유형의 조언이나 권장 사항으로 간주되지 않으며, 트레이딩뷰에서 제공하거나 보증하는 것이 아닙니다. 자세한 내용은 이용 약관을 참조하세요.