OPEN-SOURCE SCRIPT
RV- Intrinsic Value Analyzer
Why These Metrics Matter in IVA Pro (Intrinsic Value Analyzer)?
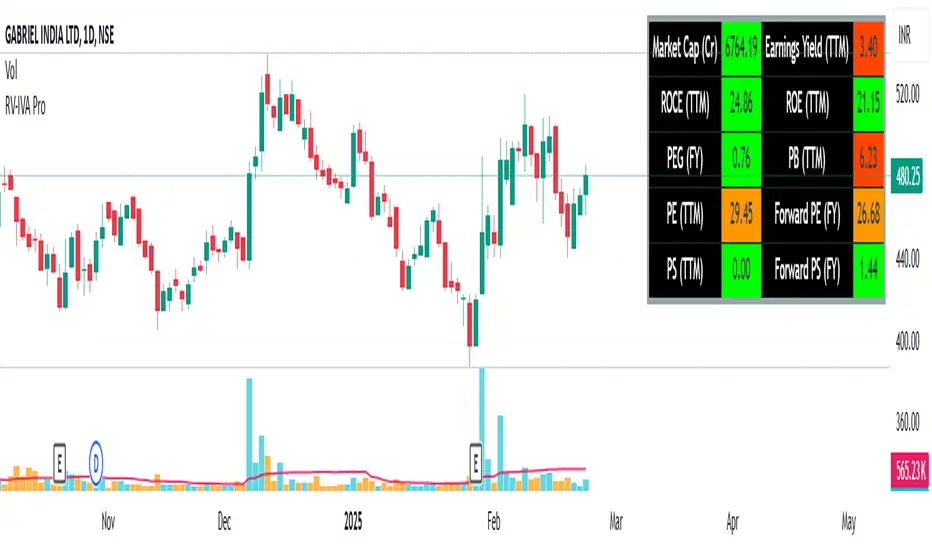
The IVA Pro consolidates key valuation, profitability, and efficiency metrics into a single, easy-to-read table. These indicators provide a comprehensive view of a company’s financial health, helping traders and investors make informed decisions based on growth potential, profitability, and valuation. The color-coded signals (green for strong, orange for moderate, and red for weak values) simplify fundamental analysis and enable quick comparisons across different stocks.
Key Fundamental Parameters in IVA Pro
- Market Capitalization (Market Cap): Measures a company's total market value, helping assess size, stability, and growth potential.
- Earnings Yield (TTM): Indicates how much profit a company generates relative to its stock price—useful for comparing against bonds and other assets.
- Return on Capital Employed (ROCE): Shows how efficiently a company generates profits using its capital—a key profitability metric.
- Return on Equity (ROE): Evaluates how well a company uses shareholder funds to generate earnings.
- Price-to-Earnings Ratio (PE): Helps determine whether a stock is overvalued or undervalued based on earnings.
- Price-to-Book Ratio (PB): Assesses if a stock is trading above or below its net asset value—useful for asset-heavy industries.
- Price-to-Sales Ratio (PS): Helps evaluate revenue potential, particularly for growth-stage companies.
- PEG Ratio: Enhances PE ratio by factoring in earnings growth—ideal for identifying undervalued growth stocks.
- Forward PE Ratio: Provides a future-looking valuation based on projected earnings.
- Forward PS Ratio: Helps evaluate future revenue potential and overall stock valuation.
오픈 소스 스크립트
트레이딩뷰의 진정한 정신에 따라, 이 스크립트의 작성자는 이를 오픈소스로 공개하여 트레이더들이 기능을 검토하고 검증할 수 있도록 했습니다. 작성자에게 찬사를 보냅니다! 이 코드는 무료로 사용할 수 있지만, 코드를 재게시하는 경우 하우스 룰이 적용된다는 점을 기억하세요.
면책사항
해당 정보와 게시물은 금융, 투자, 트레이딩 또는 기타 유형의 조언이나 권장 사항으로 간주되지 않으며, 트레이딩뷰에서 제공하거나 보증하는 것이 아닙니다. 자세한 내용은 이용 약관을 참조하세요.
오픈 소스 스크립트
트레이딩뷰의 진정한 정신에 따라, 이 스크립트의 작성자는 이를 오픈소스로 공개하여 트레이더들이 기능을 검토하고 검증할 수 있도록 했습니다. 작성자에게 찬사를 보냅니다! 이 코드는 무료로 사용할 수 있지만, 코드를 재게시하는 경우 하우스 룰이 적용된다는 점을 기억하세요.
면책사항
해당 정보와 게시물은 금융, 투자, 트레이딩 또는 기타 유형의 조언이나 권장 사항으로 간주되지 않으며, 트레이딩뷰에서 제공하거나 보증하는 것이 아닙니다. 자세한 내용은 이용 약관을 참조하세요.