OPEN-SOURCE SCRIPT
업데이트됨 [blackcat] L2 Eyman Oscillator
Level 2
Background
Eyman Oscillator
Function
The Eyman oscillator is also an analytical indicator derived from the moving average principle, which reflects the deviation between the current price and the average price over a period of time. According to the principle of moving average, the price trend can be inferred from the value of OSC. If it is far from the average, it is likely to return to the average. OSC calculation formula: Take 10-day OSC as an example: OSC = closing price of the day - 10-day average price Parameter setting: The period of the OSC indicator is generally 10 days; the average number of days of the OSC indicator can be set, and the average line of the OSC indicator can also be displayed. OSC judgment method: Take the ten-day OSC as an example: 1. The oscillator takes 0 as the center line, the OSC is above the zero line, and the market is in a strong position; if the OSC is below the zero line, the market is in a weak position. 2. OSC crosses the zero line. When the line is up, the market is strengthening, which can be regarded as a buy signal. On the contrary, if OSC falls below the zero line and continues to go down, the market is weak, and you should pay attention to selling. The degree to which the OSC value is far away should be judged based on experience.
Remarks
This is a Level 2 free and open source indicator.
Feedbacks are appreciated.
릴리즈 노트
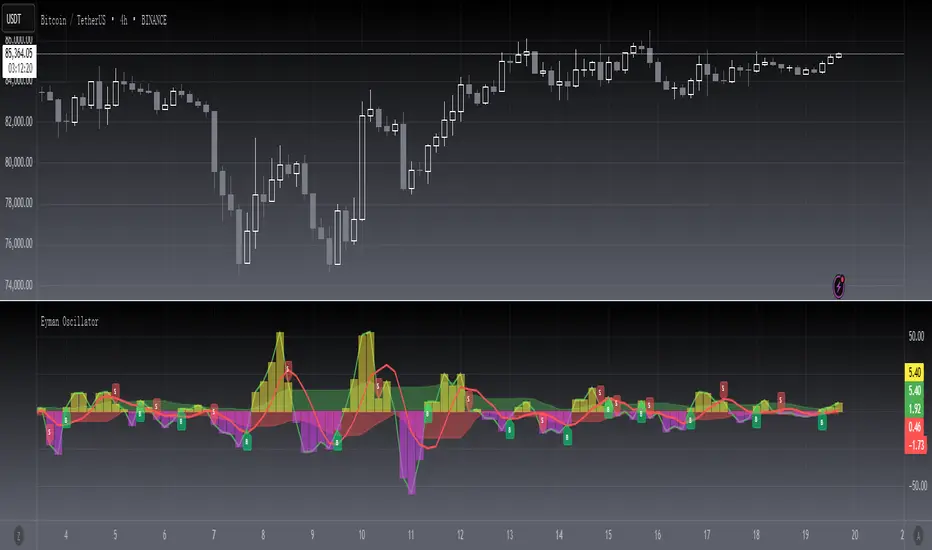
OVERVIEWThe [blackcat] L2 Eyman Oscillator is an advanced technical indicator designed to help traders identify potential buying and selling opportunities by analyzing price changes and volume factors. This script calculates various components such as volume factor, price change, cumulative price change, and oscillators to provide insights into market momentum and trends 📊✅.
FEATURES
Calculates multiple key components:
Volume Factor
Price Change
Cumulative Price Change
Short-term and Long-term Simple Moving Averages (SMAs)
Oscillator values
Bullpower and Bearpower indicators
Plots the following elements on the chart:
Bullpower area in green.
Bearpower area in red.
Oscillator line with dynamic coloring based on value.
Oscillator moving average (MA) line.
Generates buy ('B') and sell ('S') labels based on crossover and crossunder conditions 🏷️
Provides alert conditions for both buy and sell signals 🔔
HOW TO USE
Add the indicator to your TradingView chart by selecting it from the indicators list.
Observe the plotted areas and lines for insights into market momentum.
Monitor the buy ('B') and sell ('S') labels on the chart for potential trade opportunities.
Set up alerts based on the generated signals to receive notifications when conditions are met 📲.
Combine this indicator with other tools for confirmation before making trading decisions.
CALCULATED COMPONENTS
Volume Factor: Measures the impact of volume on price movements.
Price Change: Calculates the change in price adjusted by the volume factor.
Cumulative Price Change: Summarizes the price changes over a specified period.
Short-term SMA: Represents the short-term trend using a 5-period SMA.
Long-term SMA: Indicates the long-term trend using an 8-period SMA.
Oscillator: Derived from the difference between short-term and long-term SMAs.
Oscillator MA: A smoothed version of the oscillator using a 5-period SMA.
Bullpower: Aggregates positive oscillator values over 12 periods.
Bearpower: Aggregates negative oscillator values over 8 periods.
LIMITATIONS
The indicator relies heavily on volume data, which might not be reliable in all markets or timeframes.
False signals can occur in highly volatile or ranging markets 🌪️.
Users should always confirm signals with other forms of analysis.
NOTES
Ensure that you have sufficient historical data available for accurate calculations.
Test the indicator thoroughly on demo accounts before applying it to live trading 🔍.
Adjust the parameters as needed to fit different market conditions and trading styles.
오픈 소스 스크립트
트레이딩뷰의 진정한 정신에 따라, 이 스크립트의 작성자는 이를 오픈소스로 공개하여 트레이더들이 기능을 검토하고 검증할 수 있도록 했습니다. 작성자에게 찬사를 보냅니다! 이 코드는 무료로 사용할 수 있지만, 코드를 재게시하는 경우 하우스 룰이 적용된다는 점을 기억하세요.
Avoid losing contact!Don't miss out! The first and most important thing to do is to join my Discord chat now! Click here to start your adventure: discord.com/invite/ZTGpQJq 防止失联,请立即行动,加入本猫聊天群: discord.com/invite/ZTGpQJq
면책사항
해당 정보와 게시물은 금융, 투자, 트레이딩 또는 기타 유형의 조언이나 권장 사항으로 간주되지 않으며, 트레이딩뷰에서 제공하거나 보증하는 것이 아닙니다. 자세한 내용은 이용 약관을 참조하세요.