OPEN-SOURCE SCRIPT
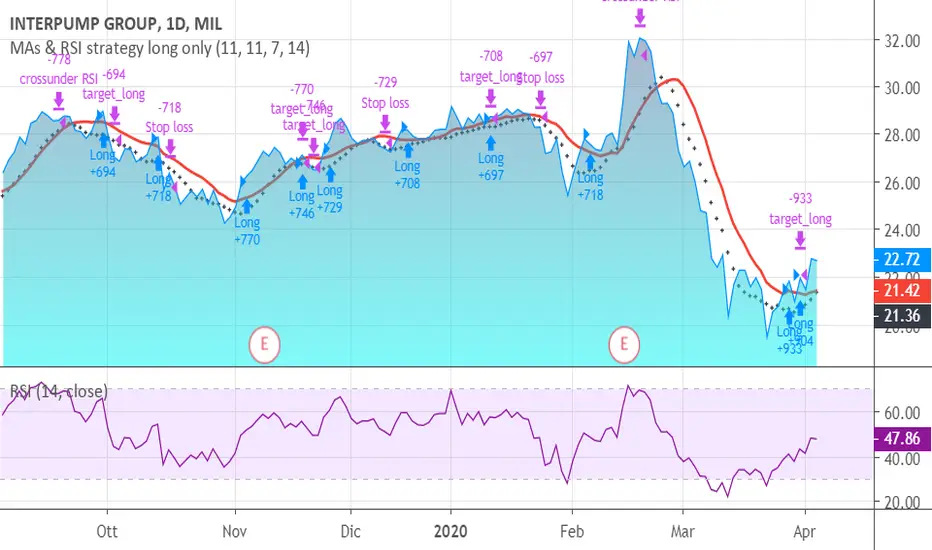
MAs & RSI strategy long only
This system originates from many articles by Enrico Malverti, Trading System, 2015.
Many trading systems are more stable if you use simple and not so innovative indicators, like exponential moving averages and Relative Strengthe index.
Differently by the original article:
- there is no ATR Filter, but we have introduced a Schaff Indicator. If you have multiple shares/commodities to choose, prefer what has a better value of Schaff;
- there is no fixed stop loss but a second moving average (fast), used as target. There are also Simple Mov Averages on lows (trailing stop loss for long) and a SMA on highs (trailing stop loss for short position).
Be careful, in the system only long case, because being short is not the reverse of being long (as stated in my blog)
SMA on highs are therefore only graphically put.
In this version, I’ve changed the “religious” use of EMAs (“sponsored by” Alexander Elder) to “ordinary” MAs: this because since simple moving averages measure all the factor in addition egual each one, this involve a sort of “offset” in the graph, while EMAs give a major “importance” to the last value (last close itself, you’re already considering): therefore this calculation may be counterproductive.
HOW TO OPERATE
BUY when prices crosses over SMAon long period (we suggest, however, sma long = Sma fast period = no. 11 for italian and european shares)
SELL when
prices go under SMA on lows (7 period), or under on SMA fast!
RSI crosses under level 70 or is higher than 75 (or 80, but in code there is 75)
오픈 소스 스크립트
트레이딩뷰의 진정한 정신에 따라, 이 스크립트의 작성자는 이를 오픈소스로 공개하여 트레이더들이 기능을 검토하고 검증할 수 있도록 했습니다. 작성자에게 찬사를 보냅니다! 이 코드는 무료로 사용할 수 있지만, 코드를 재게시하는 경우 하우스 룰이 적용된다는 점을 기억하세요.
면책사항
해당 정보와 게시물은 금융, 투자, 트레이딩 또는 기타 유형의 조언이나 권장 사항으로 간주되지 않으며, 트레이딩뷰에서 제공하거나 보증하는 것이 아닙니다. 자세한 내용은 이용 약관을 참조하세요.
오픈 소스 스크립트
트레이딩뷰의 진정한 정신에 따라, 이 스크립트의 작성자는 이를 오픈소스로 공개하여 트레이더들이 기능을 검토하고 검증할 수 있도록 했습니다. 작성자에게 찬사를 보냅니다! 이 코드는 무료로 사용할 수 있지만, 코드를 재게시하는 경우 하우스 룰이 적용된다는 점을 기억하세요.
면책사항
해당 정보와 게시물은 금융, 투자, 트레이딩 또는 기타 유형의 조언이나 권장 사항으로 간주되지 않으며, 트레이딩뷰에서 제공하거나 보증하는 것이 아닙니다. 자세한 내용은 이용 약관을 참조하세요.