OPEN-SOURCE SCRIPT
Stock Rating [TrendX_]
# OVERVIEW
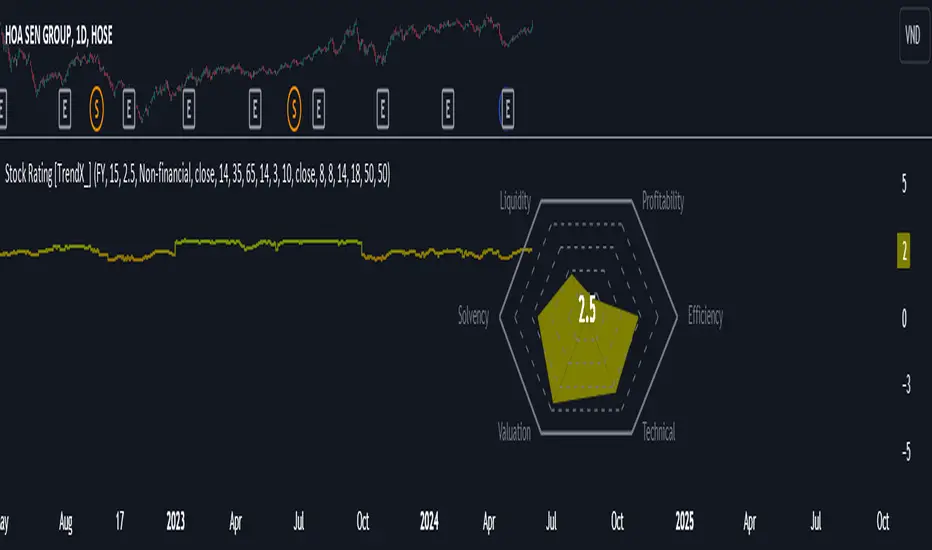
This Stock Rating [TrendX_] indicator provides a thorough evaluation of a company (NON-FINANCIAL ONLY) ranging from 0 to 5. The rating is the average of six core financial metrics: efficiency, profitability, liquidity, solvency, valuation, and technical ratings. Each metric encompasses several financial measurements to ensure a robust and holistic evaluation of the stock.
## EFFICIENCY METRICS
1. Asset-to-Liability Ratio : Measures a company's ability to cover its liabilities with its assets.
2. Equity-to-Liability Ratio : Indicates the proportion of equity used to finance the company relative to liabilities.
3. Net Margin : Shows the percentage of revenue that translates into profit.
4. Operating Expense : Reflects the costs required for normal business operations.
5. Operating Expense Ratio : Compares operating expenses to total revenue.
6. Operating Profit Ratio : Measures operating profit as a percentage of revenue.
7. PE to Industry Relative PE/PB : Compares the company's PE ratio to the industry average.
## PROFITABILITY METRICS
1. ROA : Indicates how efficiently a company uses its assets to generate profit.
2. ROE : Measures profitability relative to shareholders' equity.
3. EBITDA : Reflects a company's operational profitability.
4. Free Cash Flow Margin : Shows the percentage of revenue that remains as free cash flow.
5. Revenue Growth : Measures the percentage increase in revenue over a period.
6. Gross Margin : Reflects the percentage of revenue exceeding the cost of goods sold.
7. Net Margin : Percentage of revenue that is net profit.
8. Operating Margin : Measures the percentage of revenue that is operating profit.
## LIQUIDITY METRICS
1. Current Ratio : Indicates the ability to cover short-term obligations with short-term assets.
2. Interest Coverage Ratio : Measures the ability to pay interest on outstanding debt.
3. Debt-to-EBITDA : Compares total debt to EBITDA.
4. Debt-to-Equity Ratio : Indicates the relative proportion of debt and equity financing.
## SOLVENCY METRICS
1. Altman Z-score : Predicts bankruptcy risk
2. Beneish M-score : Detects earnings manipulation.
3. Fulmer H-factor : Predicts business failure risk.
## VALUATION METRICS
1. Industry Relative PE/PB Comparison : Compares the company's PE and PB ratios to industry averages.
2. Momentum of PE, PB, and EV/EBITDA Multiples : Tracks the trends of PE, PB, and EV/EBITDA ratios over time.
## TECHNICAL METRICS
1. Relative Strength Index (RSI) : Measures the speed and change of price movements.
2. Supertrend : Trend-following indicator that identifies market trends.
3. Moving Average Golden-Cross : Occurs when a short-term MA crosses above mid-term and long-term MA which are determined by half-PI increment in smoothing period.
4. On-Balance Volume Golden-Cross : Measures cumulative buying and selling pressure.
오픈 소스 스크립트
트레이딩뷰의 진정한 정신에 따라, 이 스크립트의 작성자는 이를 오픈소스로 공개하여 트레이더들이 기능을 검토하고 검증할 수 있도록 했습니다. 작성자에게 찬사를 보냅니다! 이 코드는 무료로 사용할 수 있지만, 코드를 재게시하는 경우 하우스 룰이 적용된다는 점을 기억하세요.
면책사항
해당 정보와 게시물은 금융, 투자, 트레이딩 또는 기타 유형의 조언이나 권장 사항으로 간주되지 않으며, 트레이딩뷰에서 제공하거나 보증하는 것이 아닙니다. 자세한 내용은 이용 약관을 참조하세요.
오픈 소스 스크립트
트레이딩뷰의 진정한 정신에 따라, 이 스크립트의 작성자는 이를 오픈소스로 공개하여 트레이더들이 기능을 검토하고 검증할 수 있도록 했습니다. 작성자에게 찬사를 보냅니다! 이 코드는 무료로 사용할 수 있지만, 코드를 재게시하는 경우 하우스 룰이 적용된다는 점을 기억하세요.
면책사항
해당 정보와 게시물은 금융, 투자, 트레이딩 또는 기타 유형의 조언이나 권장 사항으로 간주되지 않으며, 트레이딩뷰에서 제공하거나 보증하는 것이 아닙니다. 자세한 내용은 이용 약관을 참조하세요.