OPEN-SOURCE SCRIPT
NSDT Double MA Shading
This script is an interesting take on Convergence and Divergence of Moving Averages. With the built-in MACD Indicator, you cannot make these adjustments to the settings.
DESCRIPTION
The top Moving Average is calculated on the High of the candle.
The bottom Move Average is calculated on the Low of the candle.
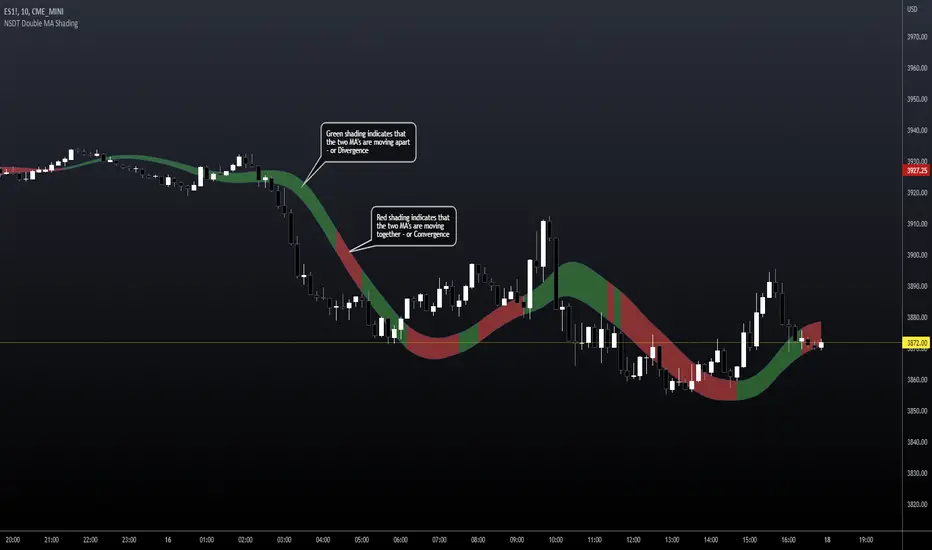
If the two are moving apart (Divergence), the shaded area between them turns Green.
If the two are moving together (Convergence), the shaded area between them turns Red.
This may help identify when a trend is becoming stronger or weaker, based on the shaded area and Moving Average direction.
POSSIBLE USAGE
For example:
If the MA's are pointing downward and the shaded area is Green - it means that average distance between the candle High and Low is getting wider, which may indicate a stronger downward movement. Then, when the shaded area turns Red, signaling the average distance between the candle High and Low are getting narrower, this may indicate that the downward movement is weakening, and may be the end of that downward trend.
SETTINGS
You can choose from EMA, SMA, WMA, RMA, HMA, TMA, and VWMA.
Although you can choose the MA Source, it is highly recommended to keep one source on the High of the candle and the other on the Low of the candle, for measure Convergence and Divergence.
All indicator settings are editable.
It can be used on Multi Timeframes (MTF).
This script is free and open source.
DESCRIPTION
The top Moving Average is calculated on the High of the candle.
The bottom Move Average is calculated on the Low of the candle.
If the two are moving apart (Divergence), the shaded area between them turns Green.
If the two are moving together (Convergence), the shaded area between them turns Red.
This may help identify when a trend is becoming stronger or weaker, based on the shaded area and Moving Average direction.
POSSIBLE USAGE
For example:
If the MA's are pointing downward and the shaded area is Green - it means that average distance between the candle High and Low is getting wider, which may indicate a stronger downward movement. Then, when the shaded area turns Red, signaling the average distance between the candle High and Low are getting narrower, this may indicate that the downward movement is weakening, and may be the end of that downward trend.
SETTINGS
You can choose from EMA, SMA, WMA, RMA, HMA, TMA, and VWMA.
Although you can choose the MA Source, it is highly recommended to keep one source on the High of the candle and the other on the Low of the candle, for measure Convergence and Divergence.
All indicator settings are editable.
It can be used on Multi Timeframes (MTF).
This script is free and open source.
오픈 소스 스크립트
트레이딩뷰의 진정한 정신에 따라, 이 스크립트의 작성자는 이를 오픈소스로 공개하여 트레이더들이 기능을 검토하고 검증할 수 있도록 했습니다. 작성자에게 찬사를 보냅니다! 이 코드는 무료로 사용할 수 있지만, 코드를 재게시하는 경우 하우스 룰이 적용된다는 점을 기억하세요.
ALL indicators, strategies and bots are included with Discord access.
NorthStarDayTrading.com/discord
youtube.com/shorts/fWFQE7uEHvU
NorthStarDayTrading.com/discord
youtube.com/shorts/fWFQE7uEHvU
면책사항
해당 정보와 게시물은 금융, 투자, 트레이딩 또는 기타 유형의 조언이나 권장 사항으로 간주되지 않으며, 트레이딩뷰에서 제공하거나 보증하는 것이 아닙니다. 자세한 내용은 이용 약관을 참조하세요.