OPEN-SOURCE SCRIPT
Chaikin's Money Flow

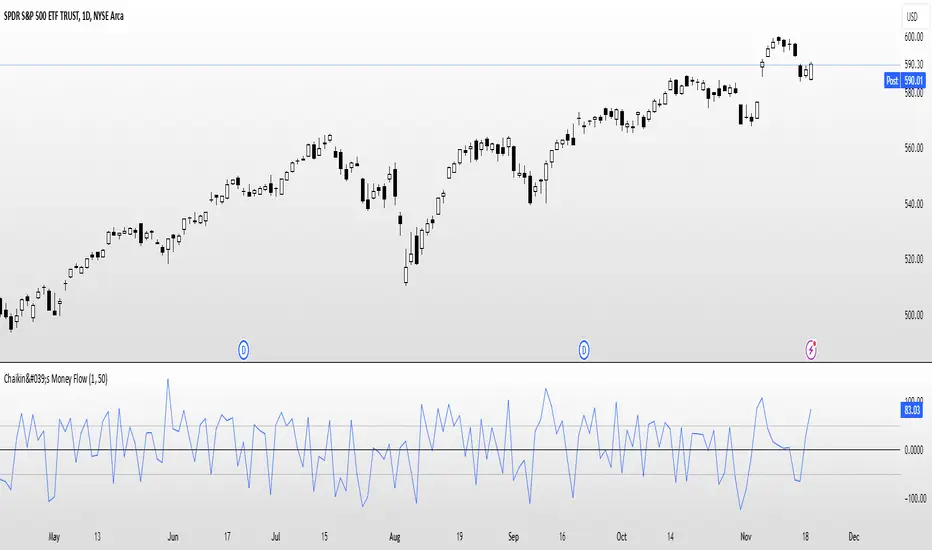
Overview: Chaikin's Money Flow (CMF) is a momentum indicator that measures the buying and selling pressure of a financial instrument over a specified period. By incorporating both price and volume, CMF provides a comprehensive view of market sentiment, helping traders identify potential trend reversals and confirm the strength of existing trends.
Key Features:
Calculation Details:
Intraday Intensity (II) = 100 × (2×Close−High−Low) / (High−Low) × Volume
Condition: If High=Low, II is set to 0 to prevent division by zero.
II_smoothed = SMA(II, lookback)
Applies a Simple Moving Average (SMA) to the Intraday Intensity over the defined lookback period to smooth out short-term fluctuations.
Volume Smoothing:
V_smoothed = EMA(Volume, Volume Smoothing Period)
Utilizes an Exponential Moving Average (EMA) to smooth the volume over the specified smoothing period, giving more weight to recent data.
Money Flow Calculation:
Money Flow = II_smoothed / V_smoothed
Condition: If Vsmoothed=0Vsmoothed=0, Money Flow is set to 0 to avoid division by zero.
Usage Instructions:
Parameters Configuration:
Interpreting the Indicator:
Complementary Analysis:
Acknowledgment: This implementation of Chaikin's Money Flow Indicator is inspired by and derived from the methodologies presented in "Statistically Sound Indicators" by Timothy Masters. The indicator has been meticulously translated to Pine Script to maintain the statistical integrity and effectiveness outlined in the source material.
Disclaimer: The Chaikin's Money Flow Indicator is a tool designed to assist in trading decisions. It does not guarantee profits and should be used in conjunction with other analysis methods. Trading involves risk, and it's essential to perform thorough testing and validation before deploying any indicator in live trading environments.
Key Features:
- Volume-Weighted: Unlike price-only indicators, CMF accounts for trading volume, offering deeper insights into the forces driving price movements.
- Oscillatory Nature: CMF oscillates between positive and negative values, typically ranging from -100 to +100, indicating the balance between buying and selling pressure.
- Trend Confirmation: Positive CMF values suggest accumulating buying pressure, while negative values indicate distributing selling pressure. This aids in confirming the direction and strength of trends.
Calculation Details:
Intraday Intensity (II) = 100 × (2×Close−High−Low) / (High−Low) × Volume
Condition: If High=Low, II is set to 0 to prevent division by zero.
II_smoothed = SMA(II, lookback)
Applies a Simple Moving Average (SMA) to the Intraday Intensity over the defined lookback period to smooth out short-term fluctuations.
Volume Smoothing:
V_smoothed = EMA(Volume, Volume Smoothing Period)
Utilizes an Exponential Moving Average (EMA) to smooth the volume over the specified smoothing period, giving more weight to recent data.
Money Flow Calculation:
Money Flow = II_smoothed / V_smoothed
Condition: If Vsmoothed=0Vsmoothed=0, Money Flow is set to 0 to avoid division by zero.
Usage Instructions:
Parameters Configuration:
- Lookback Period: Determines the number of periods over which Intraday Intensity is averaged. A higher value results in a smoother indicator, reducing sensitivity to short-term price movements.
- Volume Smoothing Period: Defines the period for the EMA applied to Volume. Adjusting this parameter affects the responsiveness of the Money Flow indicator to changes in trading volume.
Interpreting the Indicator:
- Positive Values (>0): Indicate buying pressure. The higher the value, the stronger the buying interest.
- Negative Values (<0): Signal selling pressure. The lower the value, the more intense the selling activity.
- Crossovers: Watch for Money Flow crossing above the zero line as potential buy signals and crossing below as potential sell signals.
- Divergence: Identify divergences between Money Flow and price movements to anticipate possible trend reversals.
Complementary Analysis:
- Confluence with Other Indicators: Use CMF in conjunction with trend indicators like Moving Averages or oscillators like RSI to enhance signal reliability.
- Volume Confirmation: CMF's volume-weighted approach makes it a powerful tool for confirming the validity of price trends and breakouts.
Acknowledgment: This implementation of Chaikin's Money Flow Indicator is inspired by and derived from the methodologies presented in "Statistically Sound Indicators" by Timothy Masters. The indicator has been meticulously translated to Pine Script to maintain the statistical integrity and effectiveness outlined in the source material.
Disclaimer: The Chaikin's Money Flow Indicator is a tool designed to assist in trading decisions. It does not guarantee profits and should be used in conjunction with other analysis methods. Trading involves risk, and it's essential to perform thorough testing and validation before deploying any indicator in live trading environments.
오픈 소스 스크립트
트레이딩뷰의 진정한 정신에 따라, 이 스크립트의 작성자는 이를 오픈소스로 공개하여 트레이더들이 기능을 검토하고 검증할 수 있도록 했습니다. 작성자에게 찬사를 보냅니다! 이 코드는 무료로 사용할 수 있지만, 코드를 재게시하는 경우 하우스 룰이 적용된다는 점을 기억하세요.
면책사항
해당 정보와 게시물은 금융, 투자, 트레이딩 또는 기타 유형의 조언이나 권장 사항으로 간주되지 않으며, 트레이딩뷰에서 제공하거나 보증하는 것이 아닙니다. 자세한 내용은 이용 약관을 참조하세요.
오픈 소스 스크립트
트레이딩뷰의 진정한 정신에 따라, 이 스크립트의 작성자는 이를 오픈소스로 공개하여 트레이더들이 기능을 검토하고 검증할 수 있도록 했습니다. 작성자에게 찬사를 보냅니다! 이 코드는 무료로 사용할 수 있지만, 코드를 재게시하는 경우 하우스 룰이 적용된다는 점을 기억하세요.
면책사항
해당 정보와 게시물은 금융, 투자, 트레이딩 또는 기타 유형의 조언이나 권장 사항으로 간주되지 않으며, 트레이딩뷰에서 제공하거나 보증하는 것이 아닙니다. 자세한 내용은 이용 약관을 참조하세요.