OPEN-SOURCE SCRIPT
Jarass regression lines
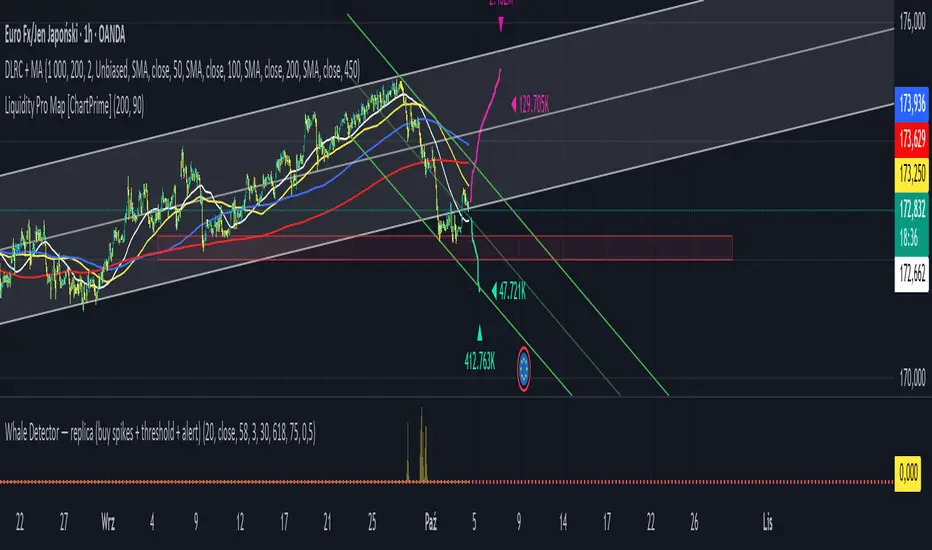
Double Linear Regression Ultimate + MA Ribbon (DLRC + MA)
The DLRC + MA indicator is an advanced technical analysis tool that combines double linear regression channels with a moving average ribbon (MA Ribbon). Designed for traders who want to simultaneously track trend, volatility, and potential support/resistance levels.
Key Features:
1. Double Linear Regression Channels:
• Inner Channel – shorter period, more sensitive to recent price movements.
• Outer Channel – longer period, reflects the long-term trend.
• Both channels display upper and lower boundaries and a midline.
• Optional logarithmic scale for price adjustment.
• Real-time R² values to assess regression accuracy.
2. MA Ribbon:
• Up to 4 different moving averages simultaneously.
• Supports SMA, EMA, SMMA (RMA), WMA, VWMA.
• Each MA can be individually enabled/disabled, with customizable period, source, and color.
• Helps identify trend direction and dynamic support/resistance levels.
3. Visualization:
• Channels are filled with semi-transparent colors for clarity.
• Midline for quick trend direction assessment.
• Label displays R² values of the channels in real time.
4. Suitable For:
• Short-term and long-term traders seeking a combination of linear regression analysis and classic trend-following tools.
• Useful for identifying overbought/oversold zones and potential trend reversal points.
Summary:
DLRC + MA combines statistical precision of linear regression with intuitive trend visualization via a MA ribbon. It provides quick insight into market direction, volatility, and potential turning points, all in one chart overlay.
오픈 소스 스크립트
트레이딩뷰의 진정한 정신에 따라, 이 스크립트의 작성자는 이를 오픈소스로 공개하여 트레이더들이 기능을 검토하고 검증할 수 있도록 했습니다. 작성자에게 찬사를 보냅니다! 이 코드는 무료로 사용할 수 있지만, 코드를 재게시하는 경우 하우스 룰이 적용된다는 점을 기억하세요.
면책사항
해당 정보와 게시물은 금융, 투자, 트레이딩 또는 기타 유형의 조언이나 권장 사항으로 간주되지 않으며, 트레이딩뷰에서 제공하거나 보증하는 것이 아닙니다. 자세한 내용은 이용 약관을 참조하세요.
오픈 소스 스크립트
트레이딩뷰의 진정한 정신에 따라, 이 스크립트의 작성자는 이를 오픈소스로 공개하여 트레이더들이 기능을 검토하고 검증할 수 있도록 했습니다. 작성자에게 찬사를 보냅니다! 이 코드는 무료로 사용할 수 있지만, 코드를 재게시하는 경우 하우스 룰이 적용된다는 점을 기억하세요.
면책사항
해당 정보와 게시물은 금융, 투자, 트레이딩 또는 기타 유형의 조언이나 권장 사항으로 간주되지 않으며, 트레이딩뷰에서 제공하거나 보증하는 것이 아닙니다. 자세한 내용은 이용 약관을 참조하세요.