PROTECTED SOURCE SCRIPT
업데이트됨 Cumulative volume analysis
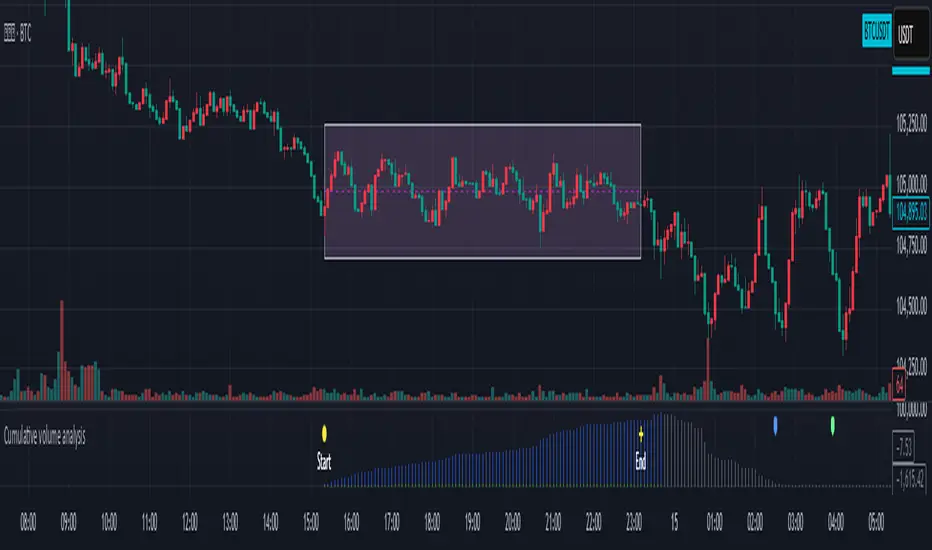
After user define the ragion area. While break out the region area, you can try this indicator to notice when the power is ended and maybe reverse the trend.
1. The user enters the start time, and end time
2. The indicator will record the highest, lowest price, and cumulative amount during this period.
The cumulative amount is calculated by adding up the amount of each K bar, regardless of whether it rises or falls.
3. When the cumulative amount is reduced to less than or equal to 0, make a plotshape arrow
4.There are two diferent method to record the volume. Try the better way to different product.
릴리즈 노트
Added more explanation below:This indicator is suitable for short-term use. I prefer the range of 5 minutes K to 1 hour K.
The chart uses 5 points K as an example.
I think this concept is my own idea, and there is no plagiarism.
If you like it, like it or share it
릴리즈 노트
Change some description into English version.보호된 스크립트입니다
이 스크립트는 비공개 소스로 게시됩니다. 하지만 이를 자유롭게 제한 없이 사용할 수 있습니다 – 자세한 내용은 여기에서 확인하세요.
면책사항
해당 정보와 게시물은 금융, 투자, 트레이딩 또는 기타 유형의 조언이나 권장 사항으로 간주되지 않으며, 트레이딩뷰에서 제공하거나 보증하는 것이 아닙니다. 자세한 내용은 이용 약관을 참조하세요.
보호된 스크립트입니다
이 스크립트는 비공개 소스로 게시됩니다. 하지만 이를 자유롭게 제한 없이 사용할 수 있습니다 – 자세한 내용은 여기에서 확인하세요.
면책사항
해당 정보와 게시물은 금융, 투자, 트레이딩 또는 기타 유형의 조언이나 권장 사항으로 간주되지 않으며, 트레이딩뷰에서 제공하거나 보증하는 것이 아닙니다. 자세한 내용은 이용 약관을 참조하세요.