INVITE-ONLY SCRIPT
업데이트됨 ICT Smart Money Liquidity Levels
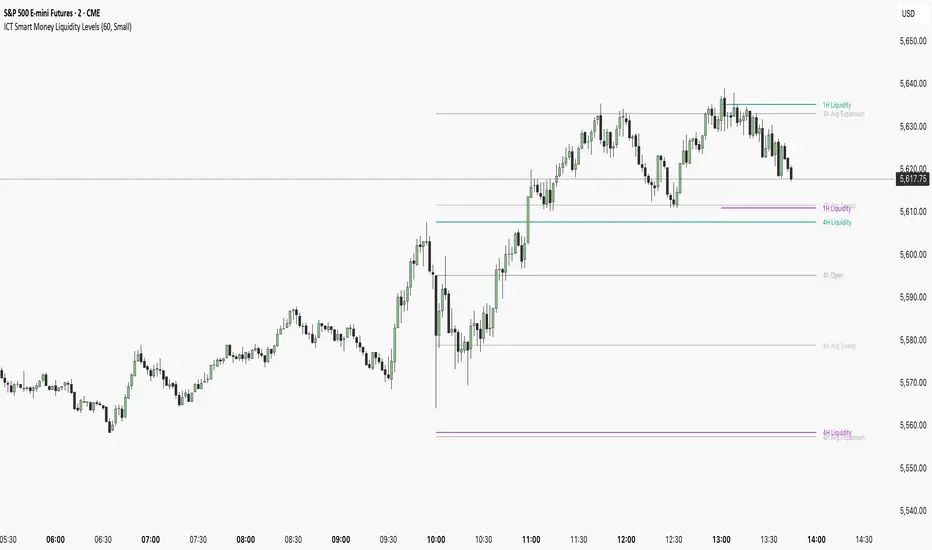
The ICT Smart Money Liquidity Levels indicator is designed to visualize key liquidity areas across multiple timeframes. Based on ICT concepts, this tool can help traders analyze price movement, liquidity sweeps, and expansion levels without switching between timeframes.
This indicator highlights liquidity levels at significant highs and lows, allowing users to track potential areas of interest where price may react. By also incorporating historical measurements, it also provides forecasted average sweep and expansion zones.
Features:
- Liquidity Levels
Plots previous HTF candle highs and lows. Available for 1H, 4H, Daily.
- Major Liquidity Levels
Highlights areas where price previously reached a significant high or low within 10 HTF candles. Available for 1H, 4H, Daily.
- Sweep and Expansion Forecast
Uses historical price data to forecast the average sweep and expansion levels for the next HTF candle. Available for 4H, Daily, Weekly, Monthly.


Why Is This Indicator Useful?
Based on ICT concepts, price seeks liquidity, often targeting trapped stops above highs and below lows before reversing or continuing its trend. High-timeframe (HTF) highs and lows, such as 1H, 4H, and Daily liquidity levels, act as natural draw points where price is likely to react. These levels represent areas where stop hunts, liquidity grabs, and institutional order flow often take place. By marking these zones, traders can anticipate where price may seek liquidity before making a significant move.
Additionally, historical liquidity sweeps and expansion zones provide insight into how price has behaved in similar situations in the past. According to ICT methodology, price often manipulates liquidity before expanding in the intended direction. By tracking average sweep and expansion levels, traders can forecast potential price movement, aligning their entries with areas where liquidity has historically been taken or distributed.
Disclaimer:
This indicator is for informational and educational purposes only. It does not provide financial, investment, or trading advice. No guarantees are made regarding accuracy, completeness, or profitability. Trading involves risk, and past performance does not indicate future results. Users are solely responsible for their trading decisions. By using this indicator, you acknowledge that the creator is not liable for any financial losses or decisions based on the information provided.
More Examples:


This indicator highlights liquidity levels at significant highs and lows, allowing users to track potential areas of interest where price may react. By also incorporating historical measurements, it also provides forecasted average sweep and expansion zones.
Features:
- Liquidity Levels
Plots previous HTF candle highs and lows. Available for 1H, 4H, Daily.
- Major Liquidity Levels
Highlights areas where price previously reached a significant high or low within 10 HTF candles. Available for 1H, 4H, Daily.
- Sweep and Expansion Forecast
Uses historical price data to forecast the average sweep and expansion levels for the next HTF candle. Available for 4H, Daily, Weekly, Monthly.
Why Is This Indicator Useful?
Based on ICT concepts, price seeks liquidity, often targeting trapped stops above highs and below lows before reversing or continuing its trend. High-timeframe (HTF) highs and lows, such as 1H, 4H, and Daily liquidity levels, act as natural draw points where price is likely to react. These levels represent areas where stop hunts, liquidity grabs, and institutional order flow often take place. By marking these zones, traders can anticipate where price may seek liquidity before making a significant move.
Additionally, historical liquidity sweeps and expansion zones provide insight into how price has behaved in similar situations in the past. According to ICT methodology, price often manipulates liquidity before expanding in the intended direction. By tracking average sweep and expansion levels, traders can forecast potential price movement, aligning their entries with areas where liquidity has historically been taken or distributed.
Disclaimer:
This indicator is for informational and educational purposes only. It does not provide financial, investment, or trading advice. No guarantees are made regarding accuracy, completeness, or profitability. Trading involves risk, and past performance does not indicate future results. Users are solely responsible for their trading decisions. By using this indicator, you acknowledge that the creator is not liable for any financial losses or decisions based on the information provided.
More Examples:
릴리즈 노트
Added 15m and 30m Liquidity Levels.초대 전용 스크립트
이 스크립트는 작성자가 승인한 사용자만 접근할 수 있습니다. 사용하려면 요청을 보내고 승인을 받아야 합니다. 일반적으로 결제 후에 승인이 이루어집니다. 자세한 내용은 아래 작성자의 지침을 따르거나 dekatrades에게 직접 문의하세요.
트레이딩뷰는 스크립트 작성자를 완전히 신뢰하고 스크립트 작동 방식을 이해하지 않는 한 스크립트 비용을 지불하거나 사용하지 않는 것을 권장하지 않습니다. 무료 오픈소스 대체 스크립트는 커뮤니티 스크립트에서 찾을 수 있습니다.
작성자 지시 사항
To get access to this indicator, visit https://dekatrades.com
면책사항
이 정보와 게시물은 TradingView에서 제공하거나 보증하는 금융, 투자, 거래 또는 기타 유형의 조언이나 권고 사항을 의미하거나 구성하지 않습니다. 자세한 내용은 이용 약관을 참고하세요.
초대 전용 스크립트
이 스크립트는 작성자가 승인한 사용자만 접근할 수 있습니다. 사용하려면 요청을 보내고 승인을 받아야 합니다. 일반적으로 결제 후에 승인이 이루어집니다. 자세한 내용은 아래 작성자의 지침을 따르거나 dekatrades에게 직접 문의하세요.
트레이딩뷰는 스크립트 작성자를 완전히 신뢰하고 스크립트 작동 방식을 이해하지 않는 한 스크립트 비용을 지불하거나 사용하지 않는 것을 권장하지 않습니다. 무료 오픈소스 대체 스크립트는 커뮤니티 스크립트에서 찾을 수 있습니다.
작성자 지시 사항
To get access to this indicator, visit https://dekatrades.com
면책사항
이 정보와 게시물은 TradingView에서 제공하거나 보증하는 금융, 투자, 거래 또는 기타 유형의 조언이나 권고 사항을 의미하거나 구성하지 않습니다. 자세한 내용은 이용 약관을 참고하세요.