INVITE-ONLY SCRIPT
The Zone Seeker Supply and Demand - by Karoshi Trading
The Zone Seeker Supply and Demand - by Karoshi Trading
The Zone Seeker is based on the Supply & Demand Methodology.
Activating this indicator will mark all the zones of your chart.
Depending on your setting preferences, some zones will be showed or not.
The indicator code works as follow:
We will use the number of consecutive candles, body size compared to the wick and body length to calculate the zones.
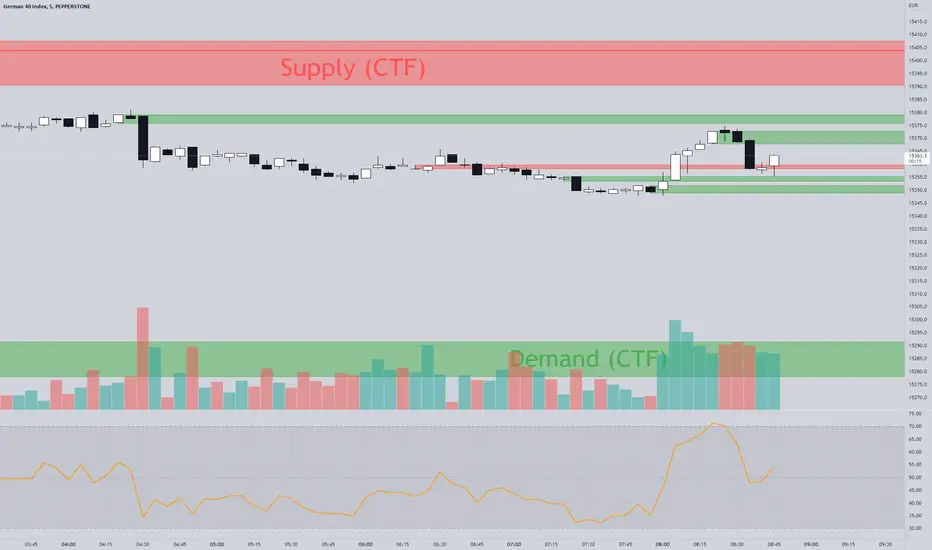
Here is an example of the indicator.
1# Consecutive Candles
The indicator will search for minimum 2 consecutive candles of the same color. That means, that both candles has to close above the opening price of each candle (Bullish) or close below there opening prices (Bearish).
2# Body Size
After the first condition is met, the Code will now look into each candles of step #1.
Each of the candles should be equal or above 50% body, to meet the second requirement.
It will calculate the body size, compared to the full candle size to determine the percentage of the body itself.
3# Body Length
If the first two steps are positive, the code will jump into the 3rd phase of the indicator, the „Body Length“. With 2 options (ATR & MA) the code will calculate within a 14 candles period the average range of the candles. With that information, the code will now compare the average range to our candles from step #1.
The candles from step #1 has to be equal or bigger than 1.5 times the range/size of the average candle to met our last requirement.
4# Demand & Supply Zones
After all 3 requirements are met, the code will search for the last candle of the opposite color, to mark a zone. As example, if we have a demand zone with all conditions met, the indicator will search for the latest candle where the price closed below the opening price.
After finding such a candle, the indicator will mark the whole range of this candle (body + wick) and create a colored rectangle with a description in it. As example „Demand CTF“
CTF = Current Time Frame

5# Testing the Zones
As a test, we only count if the price went inside or touched the zone and left it and closed outside the zone. (You can choose by yourself if touched is on or off in the settings).
The code will not count each candle as a test, but each phase where the price went into the zone and closed outside the zone. As an example, if price went into a demand zone and closes 2 candles within the zone and the 3rd candle closes above the demand zone, that will count as one test.
Each test, will change the color of the zone, to keep in track of the freshness of the zones. After the 3rd test of a zone, the zone will be automatically deleted.
6# Flipping Zones
As a flipping zone is meant, that if the demand zone get broken to the downside by 2 or less candles it will automatically turn into a fresh supply zone. Important to know is, it will only occur if the candles closes below the demand zone. Same occurs for supply zones.

7# Multiple TimeFrames
It is possible, to choose one more time frame on top of the current time frame your are actually trading.
The code will separate both time frames, so you can choose how many zones you want to see in each time frame.
The supplementary time frame zones will be in 3 different grey colors, to destinguish the zones.
Also, overlapping zones will have a little info box, to avoid overlapping text.
On top of that, you can also show "all" time frames at once.
Current Time Frame = Colorized Zones
Supplementary Time Frames = Grey Zones

The Zone Seeker is based on the Supply & Demand Methodology.
Activating this indicator will mark all the zones of your chart.
Depending on your setting preferences, some zones will be showed or not.
The indicator code works as follow:
We will use the number of consecutive candles, body size compared to the wick and body length to calculate the zones.
Here is an example of the indicator.
1# Consecutive Candles
The indicator will search for minimum 2 consecutive candles of the same color. That means, that both candles has to close above the opening price of each candle (Bullish) or close below there opening prices (Bearish).
2# Body Size
After the first condition is met, the Code will now look into each candles of step #1.
Each of the candles should be equal or above 50% body, to meet the second requirement.
It will calculate the body size, compared to the full candle size to determine the percentage of the body itself.
3# Body Length
If the first two steps are positive, the code will jump into the 3rd phase of the indicator, the „Body Length“. With 2 options (ATR & MA) the code will calculate within a 14 candles period the average range of the candles. With that information, the code will now compare the average range to our candles from step #1.
The candles from step #1 has to be equal or bigger than 1.5 times the range/size of the average candle to met our last requirement.
4# Demand & Supply Zones
After all 3 requirements are met, the code will search for the last candle of the opposite color, to mark a zone. As example, if we have a demand zone with all conditions met, the indicator will search for the latest candle where the price closed below the opening price.
After finding such a candle, the indicator will mark the whole range of this candle (body + wick) and create a colored rectangle with a description in it. As example „Demand CTF“
CTF = Current Time Frame
5# Testing the Zones
As a test, we only count if the price went inside or touched the zone and left it and closed outside the zone. (You can choose by yourself if touched is on or off in the settings).
The code will not count each candle as a test, but each phase where the price went into the zone and closed outside the zone. As an example, if price went into a demand zone and closes 2 candles within the zone and the 3rd candle closes above the demand zone, that will count as one test.
Each test, will change the color of the zone, to keep in track of the freshness of the zones. After the 3rd test of a zone, the zone will be automatically deleted.
6# Flipping Zones
As a flipping zone is meant, that if the demand zone get broken to the downside by 2 or less candles it will automatically turn into a fresh supply zone. Important to know is, it will only occur if the candles closes below the demand zone. Same occurs for supply zones.
7# Multiple TimeFrames
It is possible, to choose one more time frame on top of the current time frame your are actually trading.
The code will separate both time frames, so you can choose how many zones you want to see in each time frame.
The supplementary time frame zones will be in 3 different grey colors, to destinguish the zones.
Also, overlapping zones will have a little info box, to avoid overlapping text.
On top of that, you can also show "all" time frames at once.
Current Time Frame = Colorized Zones
Supplementary Time Frames = Grey Zones
초대 전용 스크립트
이 스크립트는 작성자가 승인한 사용자만 접근할 수 있습니다. 사용하려면 요청 후 승인을 받아야 하며, 일반적으로 결제 후에 허가가 부여됩니다. 자세한 내용은 아래 작성자의 안내를 따르거나 Karoshi-Trading에게 직접 문의하세요.
트레이딩뷰는 스크립트의 작동 방식을 충분히 이해하고 작성자를 완전히 신뢰하지 않는 이상, 해당 스크립트에 비용을 지불하거나 사용하는 것을 권장하지 않습니다. 커뮤니티 스크립트에서 무료 오픈소스 대안을 찾아보실 수도 있습니다.
작성자 지시 사항
If you want access to the indicator, please send me a message or ask for access in the comment field.
Optionally send me a mail:
contact@karoshi-trading.com
면책사항
해당 정보와 게시물은 금융, 투자, 트레이딩 또는 기타 유형의 조언이나 권장 사항으로 간주되지 않으며, 트레이딩뷰에서 제공하거나 보증하는 것이 아닙니다. 자세한 내용은 이용 약관을 참조하세요.