INVITE-ONLY SCRIPT
OG Take Off
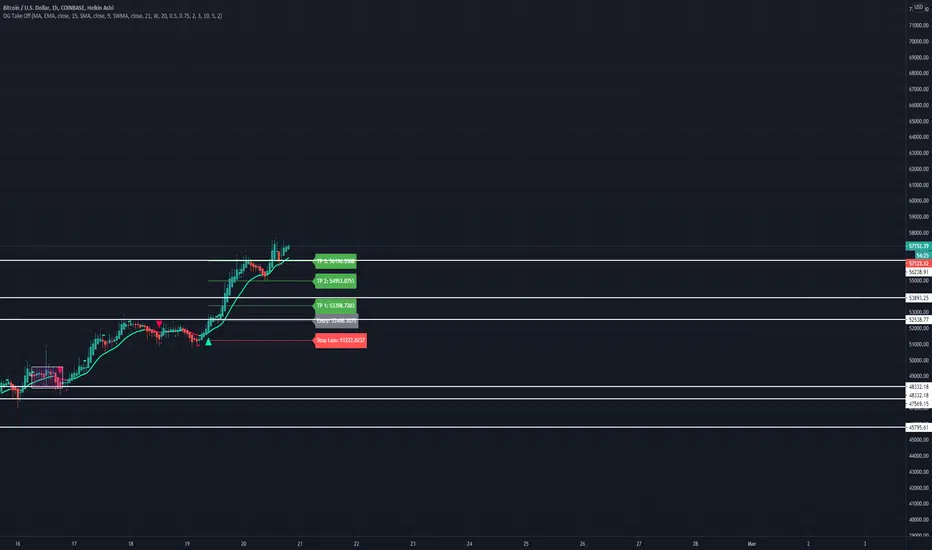
This indicator is put in place to help you identify the 3 market phases.
Consolidation can be indicated by either dots or color coded candlesticks . You can use both. Consolidation zones are represented by the dotted lines.
A green arrow indicates a buy signal. A red arrow indicates a sell signal.
Theme allows you to change the color of the background to whatever you like.
To change the color of the moving average, you must uncheck "Modern Theme Trend MA Color" under 'Style'.
When price is above 50 moving average on the higher timeframe and the color of the candle is green on the higher time frame, you are in a long market. When price is below the 50 moving average and the color of the candle is red on the higher timeframe, you are in a short market.
Trend puts a trend cloud on the chart. When green and above the 50 moving average, you can assume the market is long. Look for buys on the smaller time frame. When red and below the 50 moving average, you can assume the market is short on the smaller time frame. You can also draw an average price line through the middle of the consolidation box to tell you the directional bias.
The moving average is set to 50 by default but can be changed. You can also add 2 more moving averages to the chart. (Options: SMA , EMA , SWMA , WMA , VWMA , HMA )
Consolidation on the inputs page allows you to see when the market is consolidating with dots and color change of the candlesticks . Opacity of the dots can be changed under 'Style' (Upper Band Dots/Lower Band Dots) You can assume when the dots are below the candlestick , price is buying; when the dots ae above the candlesticks , price is selling.
't' and 'b' represent tops and bottoms and can help you recognize finding the top and bottom on the daily when doing top down analysis. It can also help you recognize double tops, double bottoms, triple tops, etc.
This indicator is best used on the 1 hr or 4 hr time frame. If you zoom out on the chart, you can notice when the market is consolidating, when the market is in expansion phase, and when the market is trending. When the market is in expansion phase, you may see a lot of 'swing low/swing high' action. When the market is trending, it takes off and doesn't look back.
If you enter on the 5 min and ride the 1 hr trend, that is a great idea. If you enter on the 15 min and ride the 4 hr trend, that is an even better idea.
The TP levels can be changed according to your risk reward ratio.
초대 전용 스크립트
이 스크립트는 작성자가 승인한 사용자만 접근할 수 있습니다. 사용하려면 요청 후 승인을 받아야 하며, 일반적으로 결제 후에 허가가 부여됩니다. 자세한 내용은 아래 작성자의 안내를 따르거나 BeeAstronaut에게 직접 문의하세요.
트레이딩뷰는 스크립트의 작동 방식을 충분히 이해하고 작성자를 완전히 신뢰하지 않는 이상, 해당 스크립트에 비용을 지불하거나 사용하는 것을 권장하지 않습니다. 커뮤니티 스크립트에서 무료 오픈소스 대안을 찾아보실 수도 있습니다.
작성자 지시 사항
Please email support@theoriginalppl.com for access.
면책사항
해당 정보와 게시물은 금융, 투자, 트레이딩 또는 기타 유형의 조언이나 권장 사항으로 간주되지 않으며, 트레이딩뷰에서 제공하거나 보증하는 것이 아닙니다. 자세한 내용은 이용 약관을 참조하세요.