INVITE-ONLY SCRIPT
RSI with OB and OS zones

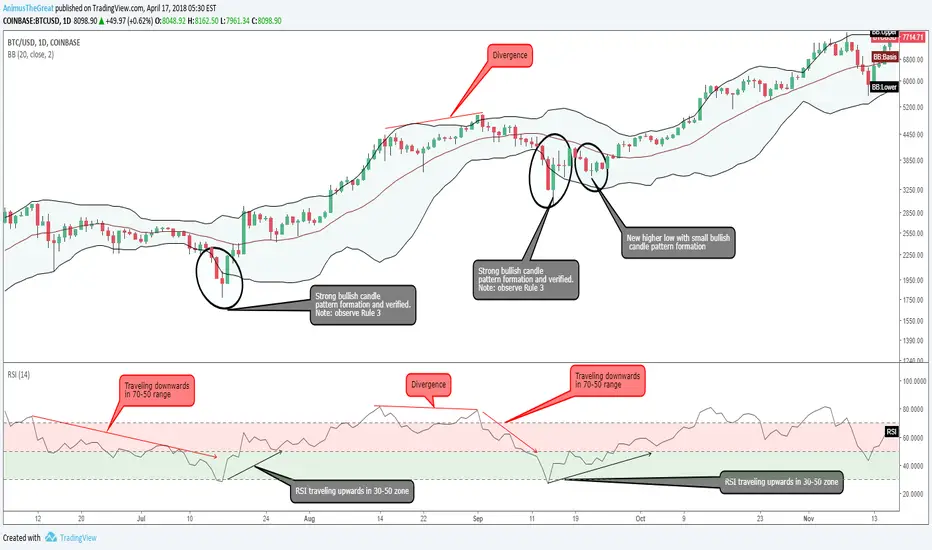
This indicator was created in order to provide better visualization of the Overbought and Oversold areas and to use those area for the principles of trading with Bollinger bands.
Basic rules for trading with BB and RSI:
- When a new high/low price trades outside a band and subsequent highs/lows are falling inside the band...signal for possible price/trend reversal.
- Compare the Bollinger bandwidth at key price levels. The bands constrict and provide an early warning signal before a big price change
Connected with RSI:
Rule #1
Once the price hits the bottom of the band, RSI needs to be in between 50 and 30. If it is for example at the 75 mark, than this might not be something you would be interested in. At the same time you need to see also RSI go up, in this case, in direction of the trade. If you are planning to short the trade, RSI needs to be in between 50-70 mark and going downward.
Rule #2- Find a cryptocurrency that is in uptrend if you are planning to go long, or downtrend if you are planning to short the trade. Skip sideways trending currencies.
Rule #3 - The currency must fall back (from the uptrend) and drops out, touches, or almost touches the bottom band. Once the price touches the bottom of the band, look a the RSI indicator for confirmation (needs to be in 30-50 range moving upwards). At the same time you need to see also RSI go up, in this case, in direction of the trade. If you are planning to short the trade, RSI needs to be in between 50-70 mark and going downward.
Rule #4: After price hits lower Bollinger band, and RSI is going upwards, make entry when…
…when you see STRONG BULLISH candle to the upside, you see consecutive reversal candles to the upside, or you find a bullish pattern forming. You need to see that the trend is moving upwards, in this case, before you enter a trade.
If the candlesticks are moving to a point where it is making a new low, this would not be a good time to enter a trade. However, once the candles fail to make a new low watch to see if it forms a bullish formation. Something else you can consider is when the price touches the middle band you can make a second entry to press your winners.
초대 전용 스크립트
이 스크립트는 작성자가 승인한 사용자만 접근할 수 있습니다. 사용하려면 요청 후 승인을 받아야 하며, 일반적으로 결제 후에 허가가 부여됩니다. 자세한 내용은 아래 작성자의 안내를 따르거나 AnimusTheGreat에게 직접 문의하세요.
트레이딩뷰는 스크립트의 작동 방식을 충분히 이해하고 작성자를 완전히 신뢰하지 않는 이상, 해당 스크립트에 비용을 지불하거나 사용하는 것을 권장하지 않습니다. 커뮤니티 스크립트에서 무료 오픈소스 대안을 찾아보실 수도 있습니다.
작성자 지시 사항
면책사항
해당 정보와 게시물은 금융, 투자, 트레이딩 또는 기타 유형의 조언이나 권장 사항으로 간주되지 않으며, 트레이딩뷰에서 제공하거나 보증하는 것이 아닙니다. 자세한 내용은 이용 약관을 참조하세요.