OPEN-SOURCE SCRIPT
Vertical & Open Lines - Yearly [MsF]
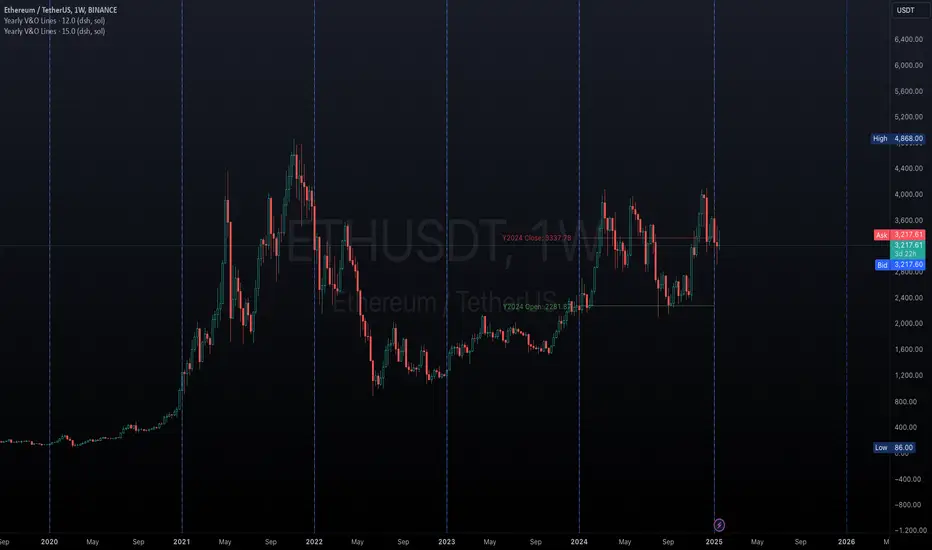
Yearly Vertical & Open Lines Indicator [OAn]
This indicator helps traders visualize yearly boundaries and track previous year's price levels. It draws:
- Vertical lines at the start of each year
- Horizontal lines showing previous year's open and close prices
- Optional labels with price information
Features:
- Customizable line colors and styles
- Toggle yearly vertical lines
- Show/hide previous year's price levels
- Optional price labels
- Next year line preview
Usage:
1. Add indicator to your chart
2. Adjust Base Time to match your market's yearly reset time
3. Customize colors and styles using input options
4. Toggle features as needed
오픈 소스 스크립트
트레이딩뷰의 진정한 정신에 따라, 이 스크립트의 작성자는 이를 오픈소스로 공개하여 트레이더들이 기능을 검토하고 검증할 수 있도록 했습니다. 작성자에게 찬사를 보냅니다! 이 코드는 무료로 사용할 수 있지만, 코드를 재게시하는 경우 하우스 룰이 적용된다는 점을 기억하세요.
면책사항
해당 정보와 게시물은 금융, 투자, 트레이딩 또는 기타 유형의 조언이나 권장 사항으로 간주되지 않으며, 트레이딩뷰에서 제공하거나 보증하는 것이 아닙니다. 자세한 내용은 이용 약관을 참조하세요.
오픈 소스 스크립트
트레이딩뷰의 진정한 정신에 따라, 이 스크립트의 작성자는 이를 오픈소스로 공개하여 트레이더들이 기능을 검토하고 검증할 수 있도록 했습니다. 작성자에게 찬사를 보냅니다! 이 코드는 무료로 사용할 수 있지만, 코드를 재게시하는 경우 하우스 룰이 적용된다는 점을 기억하세요.
면책사항
해당 정보와 게시물은 금융, 투자, 트레이딩 또는 기타 유형의 조언이나 권장 사항으로 간주되지 않으며, 트레이딩뷰에서 제공하거나 보증하는 것이 아닙니다. 자세한 내용은 이용 약관을 참조하세요.