INVITE-ONLY SCRIPT
업데이트됨 MAG Support Resistance Lines
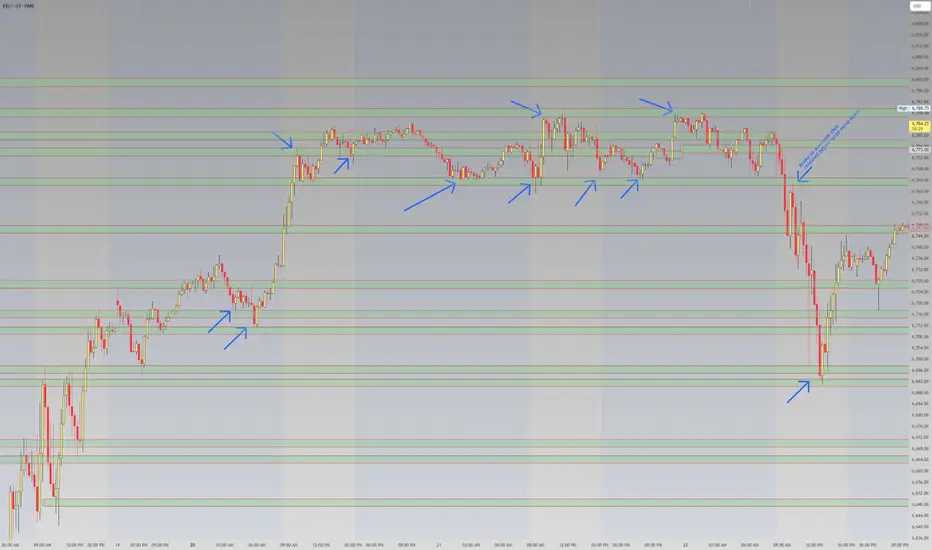
⚡ MAG Support Resistance Lines
💡 MAG S/R maps high-probability intraday reversal zones derived from directional magnitude — letting you trade where structure and liquidity truly converge.
🔍 Purpose
Automatically detects dynamic support and resistance zones using a Magnitude Bias Line — a proprietary directional-strength model built from historical price behavior.
Optimized for 1m–15m intraday charts to highlight high-impact support and resistance areas.
🧭 How It Works
Magnitude Bias Line – Computes a long-length bias curve that smooths directional flow (default 258 bars).
Pivot Detection – Identifies local highs/lows of this curve to mark potential structural turning points.
These zones DO NOT repaint, meaning the lines you see were plotted before price reached them.
Zones do expire once historic price data fed by TradingView is too far back/no longer available.
Zones should be treated as "nothing" until price action confirms it wants to respect it or continue past it.
Zone Creation –
A zone box is created around each pivot level, providing a visual approximation of potential support or resistance.
Thickness is defined by Box Height % (e.g. 0.0004 ≈ 0.04 %).
Extension & Mitigation – Zones extend forward until a new bias pivot overlaps them; new pivots replace old ones at updated price levels.
⚙️ Key Inputs
Setting | Default | Description
Magnitude Range | 258 | Controls how smooth/strong the Magnitude Bias Line is (larger = fewer zones).
Box Height % | 0.0004 | Fraction of price defining zone height (use 0.0007 on SPX, 0.0004 on ES).
Zone Color / Transparency | Green / 85% | Visual style for zone fill and border.
🕐 Timeframe Guidelines
Fitted for 1m → 15m charts. Future updates may allow higher timeframes.
If loaded outside this range, a red label reminder will appear.
🎯 Usage Tips
Watch price action for reversals or continuations at each zone. Price may V-rebound from a zone or punch through then retest the opposite side before continuing.
Utilize next zone as a TP or SL depending on your strategy rules.
Combine with VWAP, Expected Move bands, or Gamma levels for confluence.
Adjust Box Height % to match current volatility.
If you see a specific indicator that pairs well with this one, please let other's know in the comments! Together we find success and I am forever grateful to the trading communities that shared knowledge with me!
⚠️ Disclaimer (NIF)
This tool is for research and informational purposes only (Not Investment or Financial advice).
Trading involves risk; users should exercise independent judgment before making financial decisions.
릴리즈 노트
Updated preview chart릴리즈 노트
Updated range초대 전용 스크립트
이 스크립트는 작성자가 승인한 사용자만 접근할 수 있습니다. 사용하려면 요청 후 승인을 받아야 하며, 일반적으로 결제 후에 허가가 부여됩니다. 자세한 내용은 아래 작성자의 안내를 따르거나 alrtdf에게 직접 문의하세요.
트레이딩뷰는 스크립트의 작동 방식을 충분히 이해하고 작성자를 완전히 신뢰하지 않는 이상, 해당 스크립트에 비용을 지불하거나 사용하는 것을 권장하지 않습니다. 커뮤니티 스크립트에서 무료 오픈소스 대안을 찾아보실 수도 있습니다.
작성자 지시 사항
Send me a message to gain access.
면책사항
해당 정보와 게시물은 금융, 투자, 트레이딩 또는 기타 유형의 조언이나 권장 사항으로 간주되지 않으며, 트레이딩뷰에서 제공하거나 보증하는 것이 아닙니다. 자세한 내용은 이용 약관을 참조하세요.
초대 전용 스크립트
이 스크립트는 작성자가 승인한 사용자만 접근할 수 있습니다. 사용하려면 요청 후 승인을 받아야 하며, 일반적으로 결제 후에 허가가 부여됩니다. 자세한 내용은 아래 작성자의 안내를 따르거나 alrtdf에게 직접 문의하세요.
트레이딩뷰는 스크립트의 작동 방식을 충분히 이해하고 작성자를 완전히 신뢰하지 않는 이상, 해당 스크립트에 비용을 지불하거나 사용하는 것을 권장하지 않습니다. 커뮤니티 스크립트에서 무료 오픈소스 대안을 찾아보실 수도 있습니다.
작성자 지시 사항
Send me a message to gain access.
면책사항
해당 정보와 게시물은 금융, 투자, 트레이딩 또는 기타 유형의 조언이나 권장 사항으로 간주되지 않으며, 트레이딩뷰에서 제공하거나 보증하는 것이 아닙니다. 자세한 내용은 이용 약관을 참조하세요.