INVITE-ONLY SCRIPT
업데이트됨 Dominator Strategy

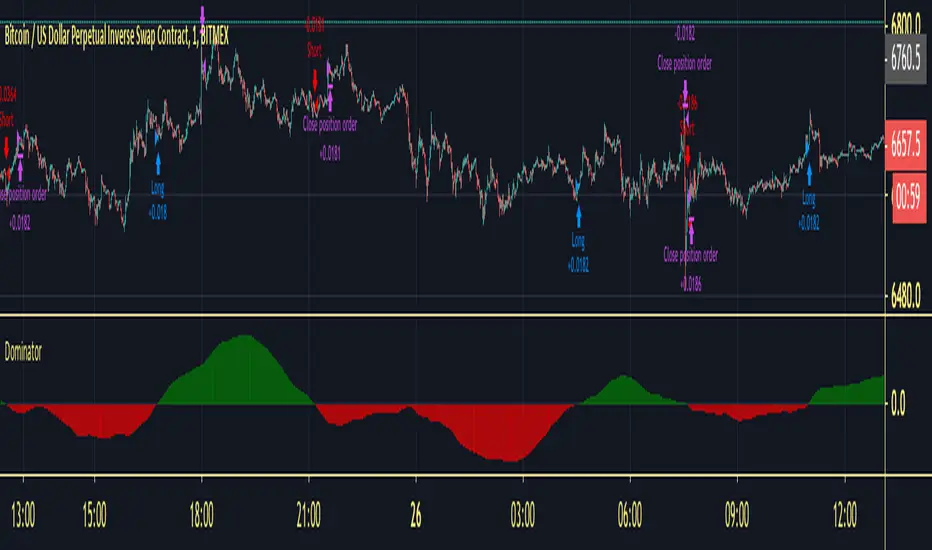
This is the Strategy Version Of Dominator you can choose your take profit level and dates for backtesting calculates fee as well
Do investors appreciate a good animal mascot? It seems like it. Bull and bear markets are key investing lingo and symbols, capturing positive feelings (bull) or negative ones (bear). There’s no official rule, but a bull market tends to refer to a 20% increase in a market over time from its bottom, while a bear represents a 20% decrease from its top. In general, “bull” positivity or “bear” negativity can refer to upward or downward movements of almost anything, like individual stocks. And you’ll even notice investors saying they’re “bullish” on an industry with growth potential or “bearish” on a stock they think will drop .
Dominator will give you the calculation of the wave between Bull&bear
How to use :
Long Alert signal = Bull Wave on the market
Short Alert signal = Bear wave on the market
Apply these fundamentals to any time frame and you will be able to read the correction into the trend or even the trend reversals.
릴리즈 노트
xD2D time frame very profitable for larger moves
릴리즈 노트
xD릴리즈 노트
xD릴리즈 노트
xD릴리즈 노트
SCalping Ready릴리즈 노트
xD릴리즈 노트
xD릴리즈 노트
xD릴리즈 노트
Time Window fixed 릴리즈 노트
adjustable time window for backtest enable 초대 전용 스크립트
이 스크립트는 작성자가 승인한 사용자만 접근할 수 있습니다. 사용하려면 요청 후 승인을 받아야 하며, 일반적으로 결제 후에 허가가 부여됩니다. 자세한 내용은 아래 작성자의 안내를 따르거나 Shenl0ng에게 직접 문의하세요.
트레이딩뷰는 스크립트의 작동 방식을 충분히 이해하고 작성자를 완전히 신뢰하지 않는 이상, 해당 스크립트에 비용을 지불하거나 사용하는 것을 권장하지 않습니다. 커뮤니티 스크립트에서 무료 오픈소스 대안을 찾아보실 수도 있습니다.
작성자 지시 사항
면책사항
해당 정보와 게시물은 금융, 투자, 트레이딩 또는 기타 유형의 조언이나 권장 사항으로 간주되지 않으며, 트레이딩뷰에서 제공하거나 보증하는 것이 아닙니다. 자세한 내용은 이용 약관을 참조하세요.
초대 전용 스크립트
이 스크립트는 작성자가 승인한 사용자만 접근할 수 있습니다. 사용하려면 요청 후 승인을 받아야 하며, 일반적으로 결제 후에 허가가 부여됩니다. 자세한 내용은 아래 작성자의 안내를 따르거나 Shenl0ng에게 직접 문의하세요.
트레이딩뷰는 스크립트의 작동 방식을 충분히 이해하고 작성자를 완전히 신뢰하지 않는 이상, 해당 스크립트에 비용을 지불하거나 사용하는 것을 권장하지 않습니다. 커뮤니티 스크립트에서 무료 오픈소스 대안을 찾아보실 수도 있습니다.
작성자 지시 사항
면책사항
해당 정보와 게시물은 금융, 투자, 트레이딩 또는 기타 유형의 조언이나 권장 사항으로 간주되지 않으며, 트레이딩뷰에서 제공하거나 보증하는 것이 아닙니다. 자세한 내용은 이용 약관을 참조하세요.