OPEN-SOURCE SCRIPT
업데이트됨 HMA w(LRLR)
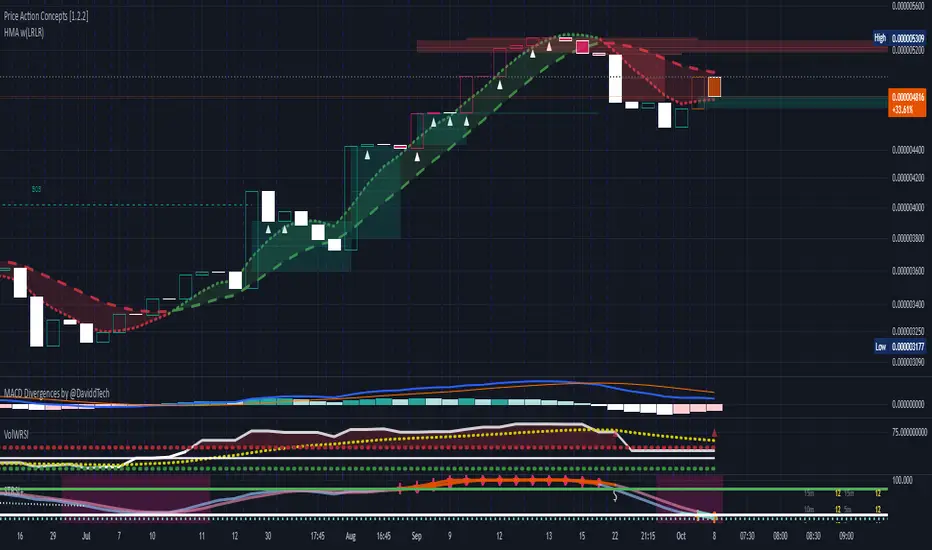
Description: This script combines a customizable Hull Moving Average (HMA) with a Low Resistance Liquidity Run (LRLR) detection system, ideal for identifying trend direction and potential breakout points in a single overlay.
Features:
Hull Moving Average (HMA):
Select separate calculation sources (open, high, low, close) for short and long periods.
Choose from SMA, EMA, and VWMA for length type on both short and long periods, offering flexible moving average calculations to suit different trading strategies.
Color-coded HMA line that visually changes based on crossover direction, providing an intuitive view of market trends.
Customizable options for line thickness, color transparency, and band fill between HMA short and long lines.
Low Resistance Liquidity Run (LRLR):
Detects breakout signals based on price and volume conditions, identifying potential liquidity run levels.
User-defined length and breakout multiplier control breakout sensitivity and adjust standard deviation-based thresholds.
Color-coded visual markers for bullish and bearish LRLR signals, customizable for user preference.
Alerts for both bullish and bearish LRLR events, keeping users informed of potential trading opportunities.
This script allows traders to visually track the HMA trend direction while also spotting low-resistance liquidity opportunities, all on one chart overlay.
Disclaimer: This tool is intended for educational purposes only and should not be used solely to make trading decisions. Adjust parameters as needed, and consider additional analysis for comprehensive decision-making.
릴리즈 노트
-Fixed bands to same color of trend (bullish/Bearish)-Fixed hma calculations ( added to source options)
- Line style now a key feature for bands
오픈 소스 스크립트
트레이딩뷰의 진정한 정신에 따라, 이 스크립트의 작성자는 이를 오픈소스로 공개하여 트레이더들이 기능을 검토하고 검증할 수 있도록 했습니다. 작성자에게 찬사를 보냅니다! 이 코드는 무료로 사용할 수 있지만, 코드를 재게시하는 경우 하우스 룰이 적용된다는 점을 기억하세요.
면책사항
해당 정보와 게시물은 금융, 투자, 트레이딩 또는 기타 유형의 조언이나 권장 사항으로 간주되지 않으며, 트레이딩뷰에서 제공하거나 보증하는 것이 아닙니다. 자세한 내용은 이용 약관을 참조하세요.
오픈 소스 스크립트
트레이딩뷰의 진정한 정신에 따라, 이 스크립트의 작성자는 이를 오픈소스로 공개하여 트레이더들이 기능을 검토하고 검증할 수 있도록 했습니다. 작성자에게 찬사를 보냅니다! 이 코드는 무료로 사용할 수 있지만, 코드를 재게시하는 경우 하우스 룰이 적용된다는 점을 기억하세요.
면책사항
해당 정보와 게시물은 금융, 투자, 트레이딩 또는 기타 유형의 조언이나 권장 사항으로 간주되지 않으며, 트레이딩뷰에서 제공하거나 보증하는 것이 아닙니다. 자세한 내용은 이용 약관을 참조하세요.