PROTECTED SOURCE SCRIPT
업데이트됨 haDelta

This Indicator is based on Mr. Dan Valcu ideas.
Bodies of candles(open-close) are the main component used to indicate and assess trend direction, strength, and reversals.
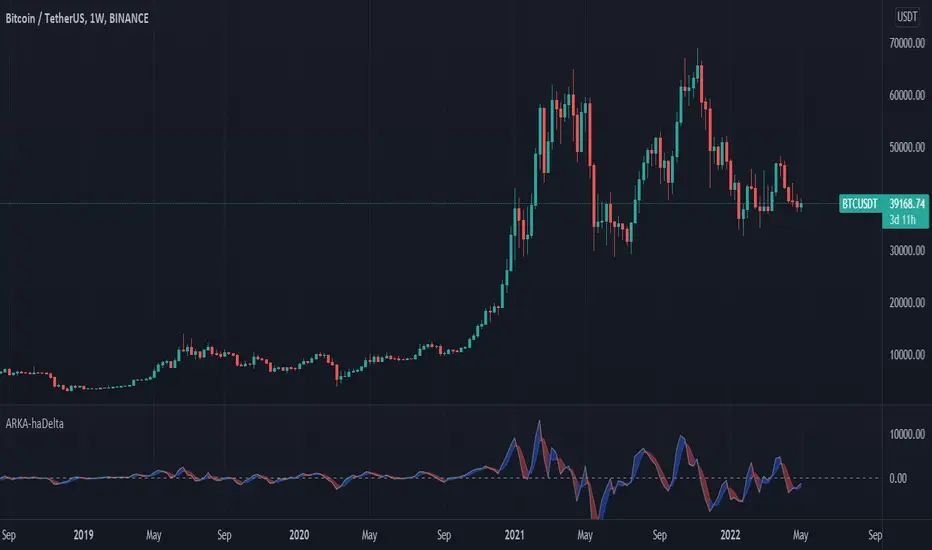
The indicator measures difference between Heikin Ashi close and open.
Measuring the height of candle bodies leads to extreme values that point to trend slowdowns. Thus quantifies Heikin Ashi to get earlier signals.
I used this indicator on Heiken Ashi charts but, it's possible to choose to calculate Body size based on Heiken Ashi or Candles.
haDelta can be smoothed with a simple moving average.
We see that crossings between the haDelta and SMA confirm trend
changes with an anticipated delay introduced by each average. Crossings between the indicator and its average are better
confirmations of trend changes.
When Delta crosses above SMA it is an uptrend.
When Delta crosses below SMA it is a downtrend.
Default haDelta smoothed value is by applying 3 periods SMA.
Also, it is possible to deactivate SMA and see just The Delta Values.
In this indicator can choose the MA period and type.
릴리즈 노트
This version has an option that makes it possible to draw dynamic levels. By choosing Dynamic from levels Type and set your preferred length. The Length value is the max value in the past candles that are used to draw the levels.
릴리즈 노트
In this version, I added the Z-score level. By choosing z-score areas the z-score is above 2 or below -2 shown by colors. I also added Alert ability into the indicator. The alert has two modes. First, when level type equals Z-Score it shows signals where delta cross ma and Z-Score are below or above high and low levels.The second mode is when the level type is not Z-Score it shows delta cross ma.
릴리즈 노트
Minor bug fix.(The color change in the style section for customization)
보호된 스크립트입니다
이 스크립트는 비공개 소스로 게시됩니다. 하지만 이를 자유롭게 제한 없이 사용할 수 있습니다 – 자세한 내용은 여기에서 확인하세요.
면책사항
해당 정보와 게시물은 금융, 투자, 트레이딩 또는 기타 유형의 조언이나 권장 사항으로 간주되지 않으며, 트레이딩뷰에서 제공하거나 보증하는 것이 아닙니다. 자세한 내용은 이용 약관을 참조하세요.
보호된 스크립트입니다
이 스크립트는 비공개 소스로 게시됩니다. 하지만 이를 자유롭게 제한 없이 사용할 수 있습니다 – 자세한 내용은 여기에서 확인하세요.
면책사항
해당 정보와 게시물은 금융, 투자, 트레이딩 또는 기타 유형의 조언이나 권장 사항으로 간주되지 않으며, 트레이딩뷰에서 제공하거나 보증하는 것이 아닙니다. 자세한 내용은 이용 약관을 참조하세요.