OPEN-SOURCE SCRIPT
Global Market Strength Indicator
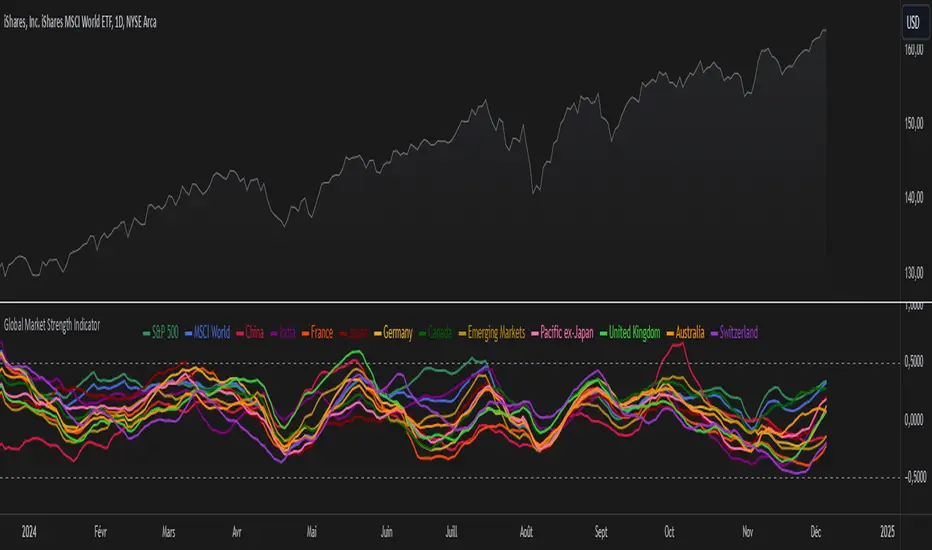
The Global Market Strength Indicator is a powerful tool for traders and investors. It helps compare the strength of various global markets and indices. This indicator uses the True Strength Index (TSI) to measure market strength.
The indicator retrieves price data for different markets and calculates their TSI values. These values are then plotted on a chart. Each market is represented by a different colored line, making it easy to distinguish between them.
One of the main benefits of this indicator is its comprehensive global view. It covers major indices and country-specific ETFs, giving users a broad perspective on global market trends. This wide coverage allows for easy comparison between different markets and regions.
The indicator is highly customizable. Users can adjust the TSI smoothing period to suit their preferences. They can also toggle the visibility of individual markets. This feature helps reduce chart clutter and allows for more focused analysis.
To use the indicator, apply it to your chart in TradingView. Adjust the settings as needed, and observe the relative positions and movements of the TSI lines. Lines moving higher indicate increasing strength in that market, while lines moving lower suggest weakening markets.
The chart includes reference lines at 0.5 and -0.5. These help identify potential overbought and oversold conditions. Markets with TSI values above 0.5 may be considered strong or potentially overbought. Those below -0.5 may be weak or potentially oversold.
By comparing the movements of different markets, users can identify which markets are leading or lagging. They can also spot potential divergences between related markets. This information can be valuable for identifying sector rotations or shifts in global market sentiment.
A dynamic legend automatically updates to show only the visible markets. This feature improves chart readability and makes it easier to interpret the data.
The Global Market Strength Indicator is a versatile tool that provides valuable insights into global market performance. It helps traders and investors identify trends, compare market performances, and make more informed decisions. Whether you're looking to spot emerging global trends or identify potential trading opportunities, this indicator offers a comprehensive solution for global market analysis.
오픈 소스 스크립트
트레이딩뷰의 진정한 정신에 따라, 이 스크립트의 작성자는 이를 오픈소스로 공개하여 트레이더들이 기능을 검토하고 검증할 수 있도록 했습니다. 작성자에게 찬사를 보냅니다! 이 코드는 무료로 사용할 수 있지만, 코드를 재게시하는 경우 하우스 룰이 적용된다는 점을 기억하세요.
Plan the trade ⚡ Trade the plan
면책사항
해당 정보와 게시물은 금융, 투자, 트레이딩 또는 기타 유형의 조언이나 권장 사항으로 간주되지 않으며, 트레이딩뷰에서 제공하거나 보증하는 것이 아닙니다. 자세한 내용은 이용 약관을 참조하세요.