INVITE-ONLY SCRIPT
업데이트됨 Impulse-Correction Mapping
About
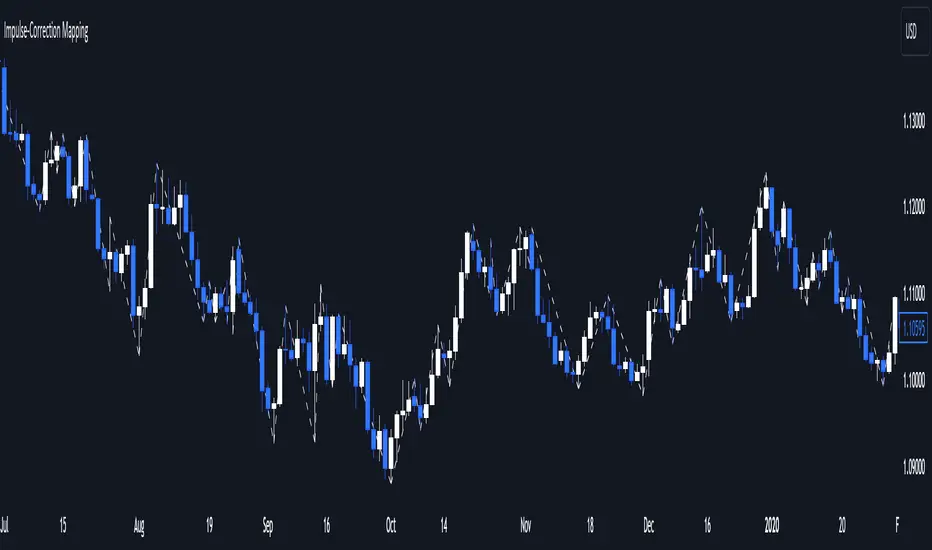
Impulse-Correction Mapper is an indicator of impulses and corrections (valid pullbacks).
Consecutive candlesticks moving in the same direction means an impulse, and a pullback below/above the previous candlestick means a correction.
This way you can identify IDM zones and find significant POIs on the chart.

Below, you can observe valid pullbacks:

And now, the invalid pullbacks:

The impulse and correction shows us the strength of the bulls or bears and also helps us to identify important liquidity areas, including IDMs.
Each high and low of the impulse-correction serves as liquidity for the institutional algorithmic bots.
The indicator can be a self-sufficient tool for market analysis and identification of liquidity swaps. If the price made a liquidity sweep - it can serve as a signal for a reversal to the nearest liquidity area.
When evaluating the daily movement, you can focus on the impulse-correction indicator: if there is a correction - it is very likely that the price will turn around and you can look for a confirmed entry point to the LTF.
The momentum-correction indicator is the basis of the entire Advanced SMC strategy - it is the foundation for determining the market structure.
Impulse-Correction Mapper is an indicator of impulses and corrections (valid pullbacks).
Consecutive candlesticks moving in the same direction means an impulse, and a pullback below/above the previous candlestick means a correction.
This way you can identify IDM zones and find significant POIs on the chart.
Below, you can observe valid pullbacks:
And now, the invalid pullbacks:
The impulse and correction shows us the strength of the bulls or bears and also helps us to identify important liquidity areas, including IDMs.
Each high and low of the impulse-correction serves as liquidity for the institutional algorithmic bots.
The indicator can be a self-sufficient tool for market analysis and identification of liquidity swaps. If the price made a liquidity sweep - it can serve as a signal for a reversal to the nearest liquidity area.
When evaluating the daily movement, you can focus on the impulse-correction indicator: if there is a correction - it is very likely that the price will turn around and you can look for a confirmed entry point to the LTF.
The momentum-correction indicator is the basis of the entire Advanced SMC strategy - it is the foundation for determining the market structure.
릴리즈 노트
+ Added option to choose line style초대 전용 스크립트
이 스크립트는 작성자가 승인한 사용자만 접근할 수 있습니다. 사용하려면 요청 후 승인을 받아야 하며, 일반적으로 결제 후에 허가가 부여됩니다. 자세한 내용은 아래 작성자의 안내를 따르거나 WinWorldTeam에게 직접 문의하세요.
트레이딩뷰는 스크립트의 작동 방식을 충분히 이해하고 작성자를 완전히 신뢰하지 않는 이상, 해당 스크립트에 비용을 지불하거나 사용하는 것을 권장하지 않습니다. 커뮤니티 스크립트에서 무료 오픈소스 대안을 찾아보실 수도 있습니다.
작성자 지시 사항
Get Access to WinWorld tools: winworld.pro
Your journey starts at coursestools.com
면책사항
해당 정보와 게시물은 금융, 투자, 트레이딩 또는 기타 유형의 조언이나 권장 사항으로 간주되지 않으며, 트레이딩뷰에서 제공하거나 보증하는 것이 아닙니다. 자세한 내용은 이용 약관을 참조하세요.
초대 전용 스크립트
이 스크립트는 작성자가 승인한 사용자만 접근할 수 있습니다. 사용하려면 요청 후 승인을 받아야 하며, 일반적으로 결제 후에 허가가 부여됩니다. 자세한 내용은 아래 작성자의 안내를 따르거나 WinWorldTeam에게 직접 문의하세요.
트레이딩뷰는 스크립트의 작동 방식을 충분히 이해하고 작성자를 완전히 신뢰하지 않는 이상, 해당 스크립트에 비용을 지불하거나 사용하는 것을 권장하지 않습니다. 커뮤니티 스크립트에서 무료 오픈소스 대안을 찾아보실 수도 있습니다.
작성자 지시 사항
Get Access to WinWorld tools: winworld.pro
Your journey starts at coursestools.com
면책사항
해당 정보와 게시물은 금융, 투자, 트레이딩 또는 기타 유형의 조언이나 권장 사항으로 간주되지 않으며, 트레이딩뷰에서 제공하거나 보증하는 것이 아닙니다. 자세한 내용은 이용 약관을 참조하세요.