OPEN-SOURCE SCRIPT
업데이트됨 Candle Thermals
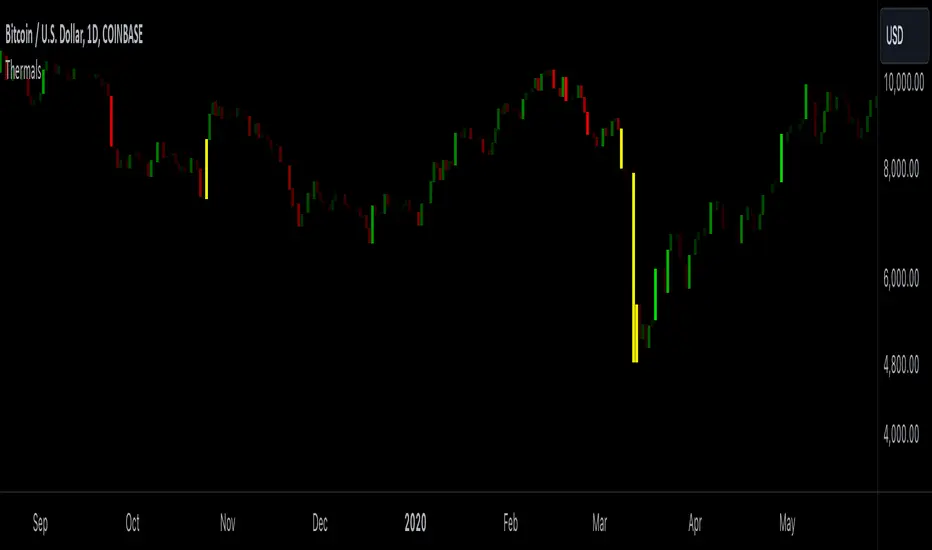
This indicator color candles based on their percentage price change, relative to the average, maximum, and minimum changes over the last 100 candles.
-It calculates the percentage change of all candles
-Calculates the minimum, maximum and average in the last 100 bars in percentage change
-Changes color of the candle based on the range between the current percent and min/max value
-The brightest candle provides the highest compound effect to you account if you act on it at the open.
-Candles that have a percentage close to the average then they are barely visible = lowest compound effect to your account
This indicator functions like a "heatmap" for candles, highlighting the relative volatility of price movements in both directions. Strong bullish candles are brighter green, and strong bearish candles are brighter red. It's particularly useful for traders wanting quick visual feedback on price volatility and strength trends within the last 100 bars.
릴리즈 노트
we have made the candles yellow if they reach maximum or minimum values in percentage change. meaning those are the candles which you will achieve the highest compound effect 오픈 소스 스크립트
트레이딩뷰의 진정한 정신에 따라, 이 스크립트의 작성자는 이를 오픈소스로 공개하여 트레이더들이 기능을 검토하고 검증할 수 있도록 했습니다. 작성자에게 찬사를 보냅니다! 이 코드는 무료로 사용할 수 있지만, 코드를 재게시하는 경우 하우스 룰이 적용된다는 점을 기억하세요.
면책사항
해당 정보와 게시물은 금융, 투자, 트레이딩 또는 기타 유형의 조언이나 권장 사항으로 간주되지 않으며, 트레이딩뷰에서 제공하거나 보증하는 것이 아닙니다. 자세한 내용은 이용 약관을 참조하세요.
오픈 소스 스크립트
트레이딩뷰의 진정한 정신에 따라, 이 스크립트의 작성자는 이를 오픈소스로 공개하여 트레이더들이 기능을 검토하고 검증할 수 있도록 했습니다. 작성자에게 찬사를 보냅니다! 이 코드는 무료로 사용할 수 있지만, 코드를 재게시하는 경우 하우스 룰이 적용된다는 점을 기억하세요.
면책사항
해당 정보와 게시물은 금융, 투자, 트레이딩 또는 기타 유형의 조언이나 권장 사항으로 간주되지 않으며, 트레이딩뷰에서 제공하거나 보증하는 것이 아닙니다. 자세한 내용은 이용 약관을 참조하세요.