OPEN-SOURCE SCRIPT
My Price Curtain by @magasine - v20251217
**My Price Curtain by magasine - v20251217**
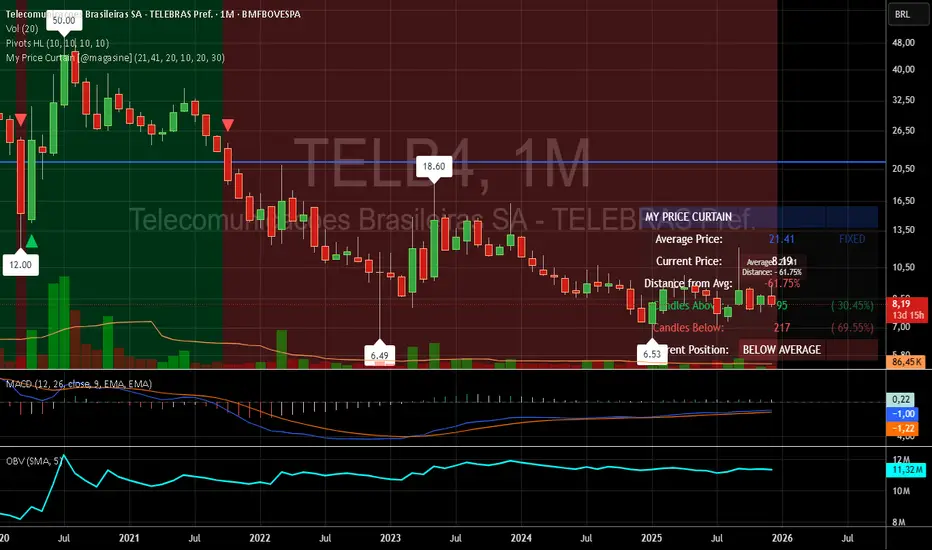
This is a highly visual and practical TradingView overlay indicator designed to help traders quickly assess price position relative to a reference average (either a dynamic Simple Moving Average or a user-defined fixed price, such as a personal average entry cost).
### Key Features & Value for Traders:
- **Dynamic Price Curtain Background**
The entire chart background is lightly tinted green when price is above the average, red when below, or gray when at parity. This instant color feedback provides an immediate sense of bullish/bearish bias without needing to interpret lines or oscillators.
- **Deviation Zones (Optional)**
When enabled, semi-transparent horizontal bands appear above (green) and below (red) the average price, sized according to a user-defined percentage deviation (default 5%). These zones act as visual "fair value" corridors, highlighting over-extension or potential mean-reversion areas.
- **Persistent Horizontal Reference Lines**
- Solid blue line: the current average price (SMA or fixed)
- Dotted lines: upper and lower deviation zone boundaries
- Thin trailing line (when using SMA): connects previous SMA values for smoother trend visualization
- **Real-Time Information Panel**
A clean table in the bottom-right corner displays:
- Current average price and type (SMA(length) or FIXED)
- Latest close price
- Percentage distance from the average
- Total candles above/below the average (with percentages)
- Current position status (ABOVE/BELOW/AT AVERAGE) with color-coded highlighting
- **Additional Visual Cues**
- Small triangle markers on crossovers/crossunders of the average price
- Floating label on the last bar showing the average and current % deviation
- **Optional Cross Alerts**
Configurable alerts fire when price crosses above or below the reference average, including price, average, and deviation details.
### Why Traders Love It:
- Perfect for position traders monitoring performance relative to their average cost
- Great for mean-reversion or range-bound strategies using the deviation zones
- Excellent contextual awareness tool on any timeframe or asset
- Clean, non-cluttered design that enhances rather than overwhelms price action
In short, My Price Curtain transforms a simple moving average into a powerful, intuitive "price sentiment dashboard" that delivers instant visual context and actionable information at a glance.
Donations: linktr.ee/magasine
오픈 소스 스크립트
트레이딩뷰의 진정한 정신에 따라, 이 스크립트의 작성자는 이를 오픈소스로 공개하여 트레이더들이 기능을 검토하고 검증할 수 있도록 했습니다. 작성자에게 찬사를 보냅니다! 이 코드는 무료로 사용할 수 있지만, 코드를 재게시하는 경우 하우스 룰이 적용된다는 점을 기억하세요.
면책사항
해당 정보와 게시물은 금융, 투자, 트레이딩 또는 기타 유형의 조언이나 권장 사항으로 간주되지 않으며, 트레이딩뷰에서 제공하거나 보증하는 것이 아닙니다. 자세한 내용은 이용 약관을 참조하세요.
오픈 소스 스크립트
트레이딩뷰의 진정한 정신에 따라, 이 스크립트의 작성자는 이를 오픈소스로 공개하여 트레이더들이 기능을 검토하고 검증할 수 있도록 했습니다. 작성자에게 찬사를 보냅니다! 이 코드는 무료로 사용할 수 있지만, 코드를 재게시하는 경우 하우스 룰이 적용된다는 점을 기억하세요.
면책사항
해당 정보와 게시물은 금융, 투자, 트레이딩 또는 기타 유형의 조언이나 권장 사항으로 간주되지 않으며, 트레이딩뷰에서 제공하거나 보증하는 것이 아닙니다. 자세한 내용은 이용 약관을 참조하세요.