OPEN-SOURCE SCRIPT
Slingshot Trend 🎯⏰
How to Use the Slingshot Trend Indicator 🎯⏰ (65-Minute Timeframe)
The **Slingshot Trend Indicator** helps spot bullish trend entries using price action and EMAs, optimized for your favorite 65-minute timeframe. Here’s a simple guide:
⚙️ Setup
- Add the indicator to your chart.
- Set the 89 EMA timeframe to 65 minutes (or keep the default 195 minutes for higher-timeframe confirmation).
🔑 Key Features
- **Slingshot EMA**: Short-term EMA (default length: 4) to detect breakouts.
- **EMA Stack**: Confirms bullish trend when 21 EMA > 34 EMA > 55 EMA > 89 EMA.
- **Price Above 89 EMA**: Ensures price is above the 65-minute 89 EMA.
- **ATR Targets**: Uses 14-period ATR for dynamic price targets.
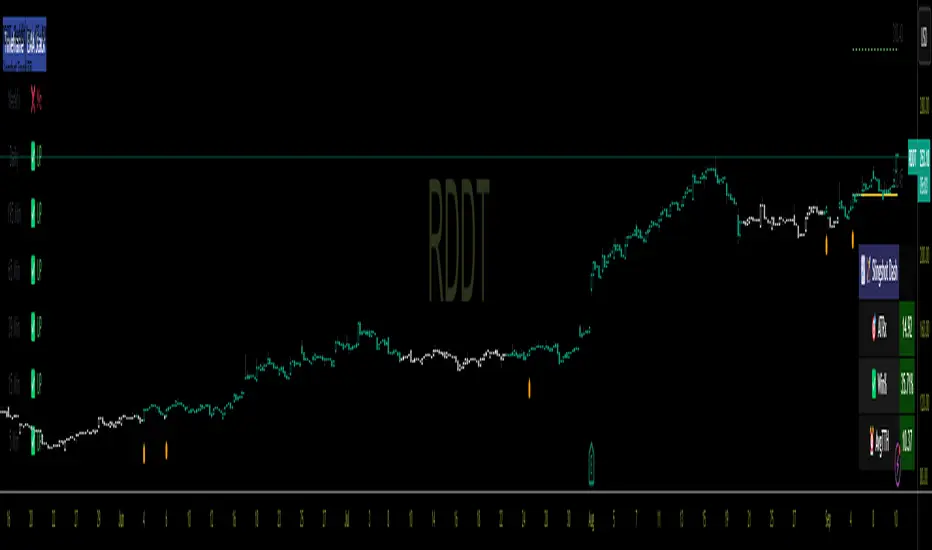
- **Visuals**:
- Blue EMA line (optional).
- Teal bars for bullish conditions (optional).
- Orange labels for entry signals (optional).
- Yellow entry line and green dashed target line (optional).
- Price labels for entry/target (optional).
- ATR dashboard showing average ATR multiple, win %, and time-to-target (optional).
📘 How to Trade
- **Entry**: Go long when an orange label appears (price closes above Slingshot EMA after three closes below, with bullish EMAs on the 65-minute chart).
- **Target**: Aim for the green dashed line (entry price + ATR-based target).
- **Exit**: Close when bullish conditions end (EMAs not stacked or price below 65-minute 89 EMA).
- **Stop Loss**: Not included; consider 2× ATR below entry or a support level.
- **Alerts**: Enable “First Trending SlingShot” for entry notifications.
✨ Customize
Adjust in settings:
- 89 EMA timeframe (e.g., set to 65 minutes).
- Bar color (default: teal).
- Toggle EMA line, bar coloring, entry labels, lines, price labels, and dashboard.
- Slingshot EMA length (default: 4).
💡 Tips
- Backtest on the 65-minute timeframe for your asset.
- Combine with support/resistance or other indicators.
- Use proper risk management.
The **Slingshot Trend Indicator** helps spot bullish trend entries using price action and EMAs, optimized for your favorite 65-minute timeframe. Here’s a simple guide:
⚙️ Setup
- Add the indicator to your chart.
- Set the 89 EMA timeframe to 65 minutes (or keep the default 195 minutes for higher-timeframe confirmation).
🔑 Key Features
- **Slingshot EMA**: Short-term EMA (default length: 4) to detect breakouts.
- **EMA Stack**: Confirms bullish trend when 21 EMA > 34 EMA > 55 EMA > 89 EMA.
- **Price Above 89 EMA**: Ensures price is above the 65-minute 89 EMA.
- **ATR Targets**: Uses 14-period ATR for dynamic price targets.
- **Visuals**:
- Blue EMA line (optional).
- Teal bars for bullish conditions (optional).
- Orange labels for entry signals (optional).
- Yellow entry line and green dashed target line (optional).
- Price labels for entry/target (optional).
- ATR dashboard showing average ATR multiple, win %, and time-to-target (optional).
📘 How to Trade
- **Entry**: Go long when an orange label appears (price closes above Slingshot EMA after three closes below, with bullish EMAs on the 65-minute chart).
- **Target**: Aim for the green dashed line (entry price + ATR-based target).
- **Exit**: Close when bullish conditions end (EMAs not stacked or price below 65-minute 89 EMA).
- **Stop Loss**: Not included; consider 2× ATR below entry or a support level.
- **Alerts**: Enable “First Trending SlingShot” for entry notifications.
✨ Customize
Adjust in settings:
- 89 EMA timeframe (e.g., set to 65 minutes).
- Bar color (default: teal).
- Toggle EMA line, bar coloring, entry labels, lines, price labels, and dashboard.
- Slingshot EMA length (default: 4).
💡 Tips
- Backtest on the 65-minute timeframe for your asset.
- Combine with support/resistance or other indicators.
- Use proper risk management.
오픈 소스 스크립트
진정한 트레이딩뷰 정신에 따라 이 스크립트 작성자는 트레이더가 기능을 검토하고 검증할 수 있도록 오픈소스로 공개했습니다. 작성자에게 찬사를 보냅니다! 무료로 사용할 수 있지만 코드를 다시 게시할 경우 하우스 룰이 적용된다는 점을 기억하세요.
면책사항
이 정보와 게시물은 TradingView에서 제공하거나 보증하는 금융, 투자, 거래 또는 기타 유형의 조언이나 권고 사항을 의미하거나 구성하지 않습니다. 자세한 내용은 이용 약관을 참고하세요.
오픈 소스 스크립트
진정한 트레이딩뷰 정신에 따라 이 스크립트 작성자는 트레이더가 기능을 검토하고 검증할 수 있도록 오픈소스로 공개했습니다. 작성자에게 찬사를 보냅니다! 무료로 사용할 수 있지만 코드를 다시 게시할 경우 하우스 룰이 적용된다는 점을 기억하세요.
면책사항
이 정보와 게시물은 TradingView에서 제공하거나 보증하는 금융, 투자, 거래 또는 기타 유형의 조언이나 권고 사항을 의미하거나 구성하지 않습니다. 자세한 내용은 이용 약관을 참고하세요.