INVITE-ONLY SCRIPT
Fourier Oscillator Suite [SeerQuant]
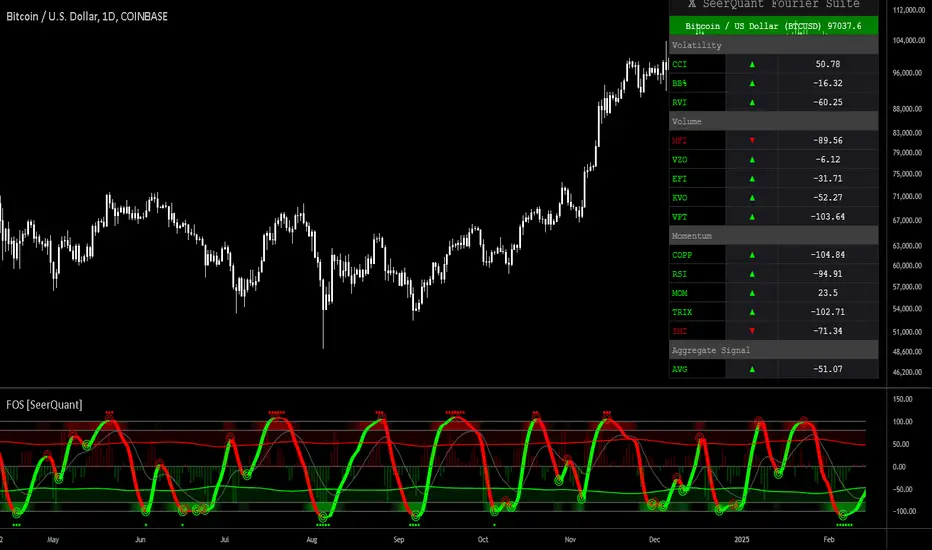
| Fourier Oscillator Suite [SeerQuant] |
WHY THE FOURIER TRANSFORM?
The Discrete Fourier Transform (DFT) extracts dominant cyclical patterns from market price data. Fourier analysis allows for the decomposition of price movements into frequency components, distinguishing trend-driven behaviour from noise and identifying oscillatory cycles within the market. This approach is effective in detecting dominant cycles in data, filtering out random fluctuations, and providing insights into price behaviour beyond conventional indicators.
This indicator applies a Fourier transform to the selected price source, converting it into a frequency-based signal. Instead of directly working with raw price data, the transformed signal acts as a smoothed and cycle-adjusted input for multiple technical indicators, enhancing their ability to adapt to market conditions dynamically.
Once the Fourier transform is applied, the extracted signal is processed through a suite of technical indicators, which are then normalized and aggregated into a single, actionable metric.
FEATURES AND BENEFITS
✅ Multi-Factor Aggregation:
By blending volatility, momentum, and volume-based oscillators, this indicator provides a comprehensive view of market conditions.
✅ Enhanced Signal Clarity:
Fourier transformation filters noise, revealing more reliable trading signals.
✅ Adaptive Market Sensitivity:
Unlike static oscillators, the Fourier-enhanced input dynamically adjusts to price shifts.
INDICATOR COMPONENTS
The Fourier Oscillator Suite aggregates the output of the transformed signal into three primary market components:
1. Volatility-Based Metrics
2. Momentum Indicators
3. Volume-Based Oscillators
These individual metrics are first normalized within a defined period and then smoothed using the selected moving average type. The final composite signal is derived from a weighted combination of the volatility, momentum, and volume components, each of which can be customized by the user.
SETTINGS
The indicator includes an extensive set of options for users to tailor its performance:
📌 Fourier Transform Parameters
📌 Aggregation Settings
📌 White Noise Control
📌 Custom Styling & Visual Enhancements
The Fourier Oscillator Suite is designed for advanced traders seeking a noise-reduced, multi-dimensional view of market dynamics. By incorporating Fourier-transformed signals into a broad range of oscillators, this tool offers a highly adaptive, filter-enhanced, and customizable approach to momentum and trend analysis. Whether you are a trend follower, mean reversion trader, or volume analyst, this suite provides actionable insights with enhanced clarity.
WHY THE FOURIER TRANSFORM?
The Discrete Fourier Transform (DFT) extracts dominant cyclical patterns from market price data. Fourier analysis allows for the decomposition of price movements into frequency components, distinguishing trend-driven behaviour from noise and identifying oscillatory cycles within the market. This approach is effective in detecting dominant cycles in data, filtering out random fluctuations, and providing insights into price behaviour beyond conventional indicators.
This indicator applies a Fourier transform to the selected price source, converting it into a frequency-based signal. Instead of directly working with raw price data, the transformed signal acts as a smoothed and cycle-adjusted input for multiple technical indicators, enhancing their ability to adapt to market conditions dynamically.
Once the Fourier transform is applied, the extracted signal is processed through a suite of technical indicators, which are then normalized and aggregated into a single, actionable metric.
FEATURES AND BENEFITS
✅ Multi-Factor Aggregation:
By blending volatility, momentum, and volume-based oscillators, this indicator provides a comprehensive view of market conditions.
✅ Enhanced Signal Clarity:
Fourier transformation filters noise, revealing more reliable trading signals.
✅ Adaptive Market Sensitivity:
Unlike static oscillators, the Fourier-enhanced input dynamically adjusts to price shifts.
INDICATOR COMPONENTS
The Fourier Oscillator Suite aggregates the output of the transformed signal into three primary market components:
1. Volatility-Based Metrics
- Commodity Channel Index (CCI) – Measures price deviation from a moving average.
- Bollinger Band %B (BB%) – Evaluates price positioning within the Bollinger Bands.
- Relative Volatility Index (RVI) – Identifies periods of heightened or subdued volatility.
2. Momentum Indicators
- Relative Strength Index (RSI) – Gauges trend momentum and overbought/oversold levels.
- Coppock Curve – A long-term momentum oscillator, often used for detecting major trend shifts.
- Momentum (MOM), TRIX, and Stochastic Momentum Index (SMI) – Further refine momentum analysis.
3. Volume-Based Oscillators
- Money Flow Index (MFI) – Measures price strength relative to volume.
- Volume Zone Oscillator (VZO) – Detects accumulation and distribution phases.
- Elder's Force Index (EFI) & Klinger Volume Oscillator (KVO) – Assess money flow strength.
These individual metrics are first normalized within a defined period and then smoothed using the selected moving average type. The final composite signal is derived from a weighted combination of the volatility, momentum, and volume components, each of which can be customized by the user.
SETTINGS
The indicator includes an extensive set of options for users to tailor its performance:
📌 Fourier Transform Parameters
- Source Selection – Choose which price input (e.g., HLC3) is used for Fourier analysis.
- Fourier Period – Defines the number of cycles analyzed for signal extraction.
📌 Aggregation Settings
- Normalization Period – Controls how indicator values are scaled.
- Smoothing Length – Adjusts the sensitivity of moving averages applied to oscillators.
- Weight Adjustments – Fine-tune the impact of volatility, momentum, and volume-based inputs on the final signal.
📌 White Noise Control
- White Noise Amplitude & Period – Filters out excessive market noise to improve signal clarity.
- Enable/Disable White Noise Overlay – Provides optional visualization of filtered noise levels.
📌 Custom Styling & Visual Enhancements
- Selectable Color Schemes – Choose from Default, Modern, Cool, or Monochrome.
- Bull & Bear Color Customization – Define custom colors for positive/negative momentum shifts.
- Adaptive Gradient Fills – Highlights market conditions dynamically based on oscillator movements.
The Fourier Oscillator Suite is designed for advanced traders seeking a noise-reduced, multi-dimensional view of market dynamics. By incorporating Fourier-transformed signals into a broad range of oscillators, this tool offers a highly adaptive, filter-enhanced, and customizable approach to momentum and trend analysis. Whether you are a trend follower, mean reversion trader, or volume analyst, this suite provides actionable insights with enhanced clarity.
초대 전용 스크립트
이 스크립트는 작성자가 승인한 사용자만 접근할 수 있습니다. 사용하려면 요청 후 승인을 받아야 하며, 일반적으로 결제 후에 허가가 부여됩니다. 자세한 내용은 아래 작성자의 안내를 따르거나 SeerQuant에게 직접 문의하세요.
트레이딩뷰는 스크립트의 작동 방식을 충분히 이해하고 작성자를 완전히 신뢰하지 않는 이상, 해당 스크립트에 비용을 지불하거나 사용하는 것을 권장하지 않습니다. 커뮤니티 스크립트에서 무료 오픈소스 대안을 찾아보실 수도 있습니다.
작성자 지시 사항
Private, invite only.
Follow along on X for daily market updates!
면책사항
해당 정보와 게시물은 금융, 투자, 트레이딩 또는 기타 유형의 조언이나 권장 사항으로 간주되지 않으며, 트레이딩뷰에서 제공하거나 보증하는 것이 아닙니다. 자세한 내용은 이용 약관을 참조하세요.