OPEN-SOURCE SCRIPT
High Volume Vector Candles
High Volume Vector Candles highlights candles where trading activity significantly exceeds the average, helping you quickly identify powerful moves driven by strong volume.
How it works:
- The script calculates a moving average of volume over a user-defined period.
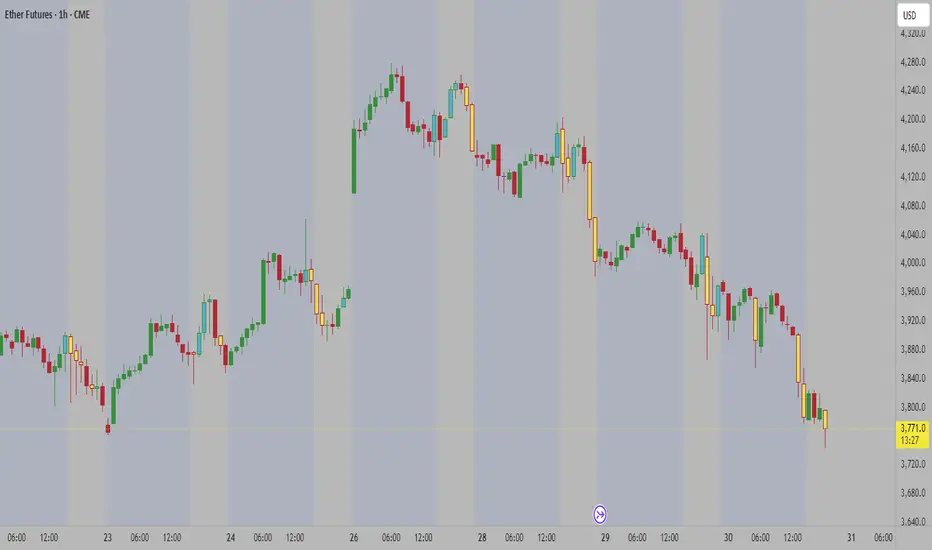
- When current volume exceeds the chosen threshold (e.g. 150% of the average), the candle is marked as a high-volume event.
- Bullish high-volume candles are highlighted in blue tones, while bearish ones are shown in yellow, both with adjustable opacity.
This visualization makes it easier to spot potential breakout points, absorption zones, or institutional activity directly on your chart.
Customizable Settings:
• Moving average length
• Threshold percentage above average
• Bullish/Bearish highlight colors
• Opacity level
Ideal for traders who combine price action with volume analysis to anticipate market momentum.
How it works:
- The script calculates a moving average of volume over a user-defined period.
- When current volume exceeds the chosen threshold (e.g. 150% of the average), the candle is marked as a high-volume event.
- Bullish high-volume candles are highlighted in blue tones, while bearish ones are shown in yellow, both with adjustable opacity.
This visualization makes it easier to spot potential breakout points, absorption zones, or institutional activity directly on your chart.
Customizable Settings:
• Moving average length
• Threshold percentage above average
• Bullish/Bearish highlight colors
• Opacity level
Ideal for traders who combine price action with volume analysis to anticipate market momentum.
오픈 소스 스크립트
트레이딩뷰의 진정한 정신에 따라, 이 스크립트의 작성자는 이를 오픈소스로 공개하여 트레이더들이 기능을 검토하고 검증할 수 있도록 했습니다. 작성자에게 찬사를 보냅니다! 이 코드는 무료로 사용할 수 있지만, 코드를 재게시하는 경우 하우스 룰이 적용된다는 점을 기억하세요.
면책사항
해당 정보와 게시물은 금융, 투자, 트레이딩 또는 기타 유형의 조언이나 권장 사항으로 간주되지 않으며, 트레이딩뷰에서 제공하거나 보증하는 것이 아닙니다. 자세한 내용은 이용 약관을 참조하세요.
오픈 소스 스크립트
트레이딩뷰의 진정한 정신에 따라, 이 스크립트의 작성자는 이를 오픈소스로 공개하여 트레이더들이 기능을 검토하고 검증할 수 있도록 했습니다. 작성자에게 찬사를 보냅니다! 이 코드는 무료로 사용할 수 있지만, 코드를 재게시하는 경우 하우스 룰이 적용된다는 점을 기억하세요.
면책사항
해당 정보와 게시물은 금융, 투자, 트레이딩 또는 기타 유형의 조언이나 권장 사항으로 간주되지 않으며, 트레이딩뷰에서 제공하거나 보증하는 것이 아닙니다. 자세한 내용은 이용 약관을 참조하세요.