INVITE-ONLY SCRIPT
업데이트됨 MTF Lag-Less RasterChart (Spectrogram/HeatMap)
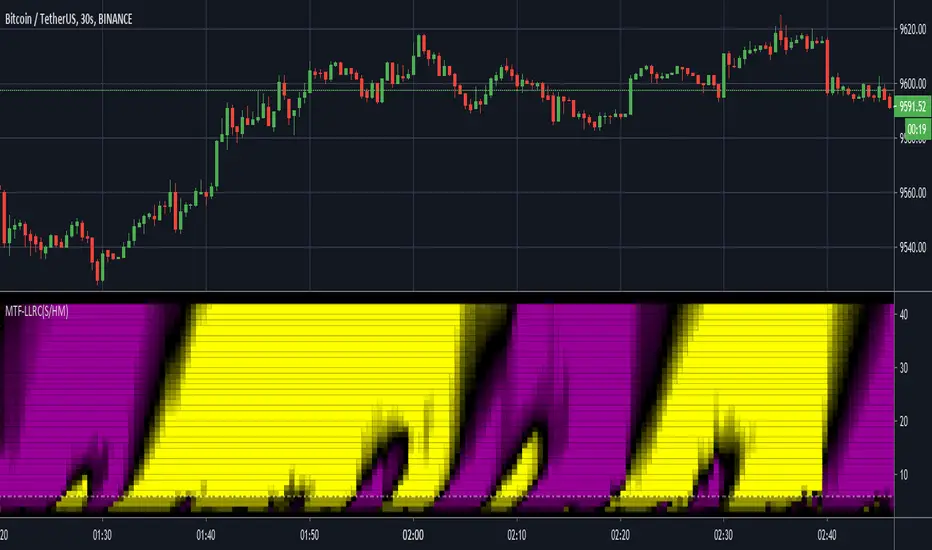
I present yet another state-of-the-art "MTF Lag-Less RasterChart" employing PSv4.0. Simply describing how this indicator works, the bottom of the indicator pane is most reactive and is highly effective at identifying reversal points quickly once they occur, while the upper portion of the indicator commonly shows enduring trends. This may be my finest multi-timeframe heatmap indicator that I have created so far, complete with multiple stunning gradient color schemes. I'm unsure if I will be able to pack any more tech into these RasterCharts. This may exclude additional algorithms or polychromatics I may discover later on that are worthy of other RasterChart releases. One last thing, this is a companion indicator to my "Lag-Less Rainbow Ribbon" indicator, because the heavily modified base algorithms are nearly identical.
I once again would like to personally thank Dr . John Ehlers for inspiring me to ponder into the realm of heatmap technology and all it has to offer. Your mathemagical splendor is most appreciated! You're a divine inspiration to the algorithmic trading community and forever shall be.
The MTF capabilities include seconds, minutes, and days. If the time frame settings are shorter in time than the current sampling interval, a warning notification will be appropriately displayed. I included a horizontal rule to approximately gauge at what level you may wish to have before entering/exiting a trade upon identifying a trend change. This gizmo functions on all assets on time frames ranging from one second bars up to the "All" chart having monthly bars.
Lastly, I have included so many color scheming techniques that I couldn't demonstrate all of them above. This indicator has what I would term as enhanced "predator" vision. For those of you who have witnessed these movies, you may understand what I have built. This indicator additionally includes a color morphing control to perfectly adjust the gradients to your visual liking, on any time frame whether it be seconds or daily chart preferences. The use of this indicator is just like any of my other RasterCharts or heatmap indicators found on the internet, except it has the greatest versatility I have accomplished as of yet.
Features List Includes:
"Source" selection
MTF controls for seconds, minutes, and days
Adjustable horizontal rule to differentiate between more reactive aspects of turning point fluctuations in the lower portion of the chart (visible above)
Window aperture control
Adjustable heatmap brightness control
Visual color scheme techniques (a few of many are displayed above)
Color gradient morphing
Color inversion control
This is not a freely available indicator, FYI. To witness my Pine poetry in action, properly negotiated requests for unlimited access, per indicator, may ONLY be obtained by direct contact with me using TV's "Private Chats" or by "Message" hidden in my member name above. The comments section below is solely just for commenting and other remarks, ideas, compliments, etc... regarding only this indicator, not others. When available time provides itself, I will consider your inquiries, thoughts, and concepts presented below in the comments section, should you have any questions or comments regarding this indicator. When my indicators achieve more prevalent use by TV members, I may implement more ideas when they present themselves as worthy additions. As always, "Like" it if you simply just like it with a proper thumbs up, and also return to my scripts list occasionally for additional postings. Have a profitable future everyone!
릴리즈 노트
Mostly cleaned up Settings for a sleek appearance and a gentle code cleanup.초대 전용 스크립트
이 스크립트는 작성자가 승인한 사용자만 접근할 수 있습니다. 사용하려면 요청 후 승인을 받아야 하며, 일반적으로 결제 후에 허가가 부여됩니다. 자세한 내용은 아래 작성자의 안내를 따르거나 ImmortalFreedom에게 직접 문의하세요.
트레이딩뷰는 스크립트의 작동 방식을 충분히 이해하고 작성자를 완전히 신뢰하지 않는 이상, 해당 스크립트에 비용을 지불하거나 사용하는 것을 권장하지 않습니다. 커뮤니티 스크립트에서 무료 오픈소스 대안을 찾아보실 수도 있습니다.
작성자 지시 사항
면책사항
해당 정보와 게시물은 금융, 투자, 트레이딩 또는 기타 유형의 조언이나 권장 사항으로 간주되지 않으며, 트레이딩뷰에서 제공하거나 보증하는 것이 아닙니다. 자세한 내용은 이용 약관을 참조하세요.
초대 전용 스크립트
이 스크립트는 작성자가 승인한 사용자만 접근할 수 있습니다. 사용하려면 요청 후 승인을 받아야 하며, 일반적으로 결제 후에 허가가 부여됩니다. 자세한 내용은 아래 작성자의 안내를 따르거나 ImmortalFreedom에게 직접 문의하세요.
트레이딩뷰는 스크립트의 작동 방식을 충분히 이해하고 작성자를 완전히 신뢰하지 않는 이상, 해당 스크립트에 비용을 지불하거나 사용하는 것을 권장하지 않습니다. 커뮤니티 스크립트에서 무료 오픈소스 대안을 찾아보실 수도 있습니다.
작성자 지시 사항
면책사항
해당 정보와 게시물은 금융, 투자, 트레이딩 또는 기타 유형의 조언이나 권장 사항으로 간주되지 않으며, 트레이딩뷰에서 제공하거나 보증하는 것이 아닙니다. 자세한 내용은 이용 약관을 참조하세요.