OPEN-SOURCE SCRIPT
Squeeze Momentum Indicator
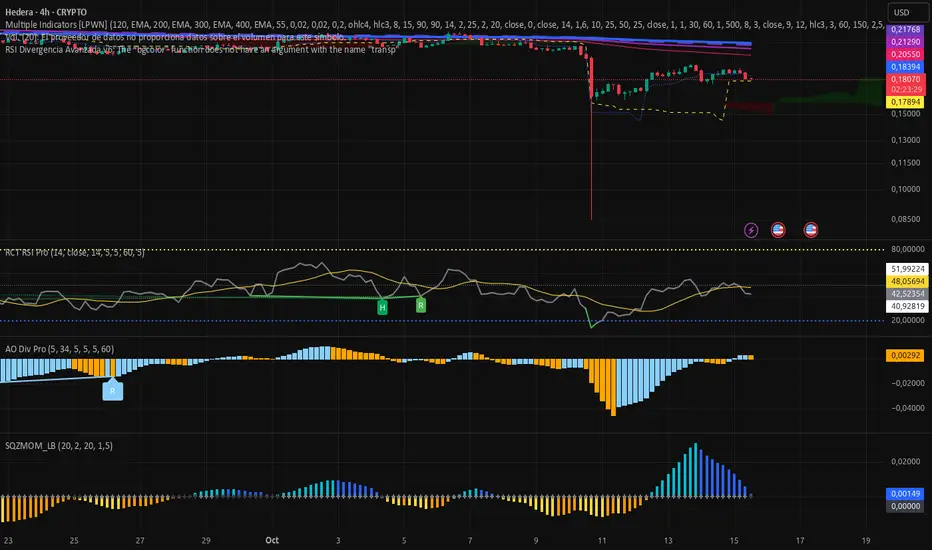
This indicator identifies periods of low market volatility—commonly referred to as a "squeeze"—by comparing Bollinger Bands and Keltner Channels. When volatility compresses, price often prepares for a directional breakout. The histogram visualizes momentum strength and direction once the squeeze ends.
**How it works:**
- **Squeeze detection**: A squeeze is active when Bollinger Bands are fully contained within Keltner Channels. This appears as black crosses on the zero line.
- **Volatility expansion**: When Bollinger Bands move outside Keltner Channels, volatility is increasing. This state is marked with blue crosses.
- **Momentum histogram**: The core signal is a linear regression of price relative to a dynamic baseline (average of the highest high, lowest low, and SMA over the lookback period).
- **Aqua**: Positive momentum that is accelerating.
- **Bright blue**: Positive momentum that is decelerating.
- **Yellow**: Negative momentum that is accelerating downward.
- **Orange**: Negative momentum that is decelerating (potential reversal zone).
**Usage notes:**
Traders often monitor the transition from squeeze (black) to expansion (blue) combined with a strong histogram move away from zero as a potential entry signal. Color changes in the histogram help assess momentum shifts before price makes large moves.
This script is designed for educational and analytical purposes. It does not constitute investment advice. Always test strategies in a simulated environment before applying them to live trading.
오픈 소스 스크립트
진정한 트레이딩뷰 정신에 따라 이 스크립트 작성자는 트레이더가 기능을 검토하고 검증할 수 있도록 오픈소스로 공개했습니다. 작성자에게 찬사를 보냅니다! 무료로 사용할 수 있지만 코드를 다시 게시할 경우 하우스 룰이 적용된다는 점을 기억하세요.
면책사항
이 정보와 게시물은 TradingView에서 제공하거나 보증하는 금융, 투자, 거래 또는 기타 유형의 조언이나 권고 사항을 의미하거나 구성하지 않습니다. 자세한 내용은 이용 약관을 참고하세요.
오픈 소스 스크립트
진정한 트레이딩뷰 정신에 따라 이 스크립트 작성자는 트레이더가 기능을 검토하고 검증할 수 있도록 오픈소스로 공개했습니다. 작성자에게 찬사를 보냅니다! 무료로 사용할 수 있지만 코드를 다시 게시할 경우 하우스 룰이 적용된다는 점을 기억하세요.
면책사항
이 정보와 게시물은 TradingView에서 제공하거나 보증하는 금융, 투자, 거래 또는 기타 유형의 조언이나 권고 사항을 의미하거나 구성하지 않습니다. 자세한 내용은 이용 약관을 참고하세요.