INVITE-ONLY SCRIPT
업데이트됨 Vini Algo Strategy
This strategy is intended to be used on an trading platform and should be run on a 5, 10, 15 minute chart for confirmations and signal relay to crypto platform.
I have spent quite a bit of time and I figured I would put it out to the community to share the work.
Ok, so let me say that I have spent some amount of time to make the indicator/Strategy not to repaint while still maintaining it's profitability. It has been a challenge so I am publishing.
What I have observed: the strategy will not repaint in real time.
Channel Balance
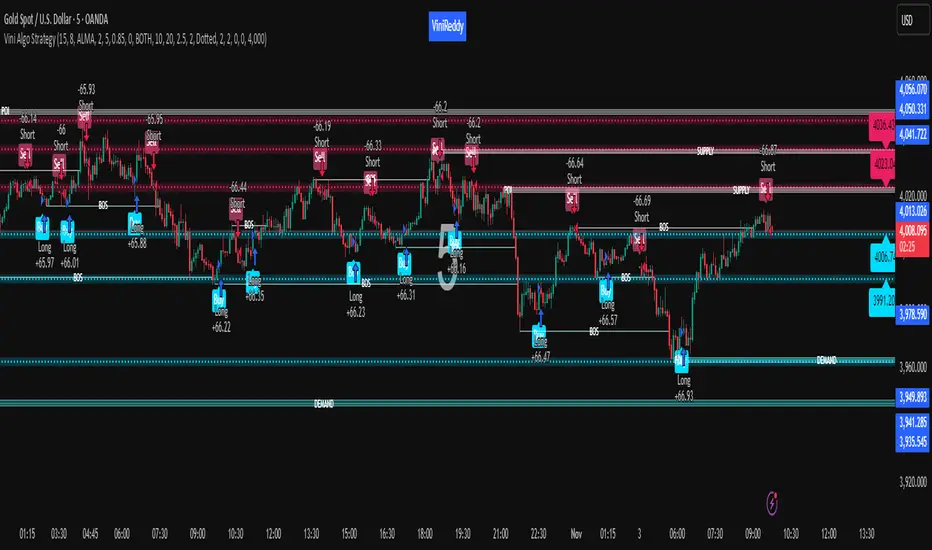
Bright Magenta Upper (Supply) side with Standard Deviation Interpretation +1σ, +2σ, +3σ above the mean — statistically “overbought” areas where price may reverse or slow down
Bright Cyan Lower (Demand) side with Standard Deviation Interpretation −1σ, −2σ, −3σ below the mean — “oversold” areas where buying interest may return
Supply Zone ---->> Resistance / Sell area
Demand Zone ------>> Support / Buy area
BOS ----->> Market structure break
Buy/Long markers ----->> Potential entry for long trades
Sell/Short markers ----->> Potential entry for short trades
Limitation on lower timeframe chart
That is, if you have the chart open and keep it open, the signals are the same as the ones that are sent out by the strategy. In certain cases, when I reload the chart- the signals might be off from what was sent. In some ways, that is repainting, but it is repainting based on losing the real time data and recalculating from a different set of bars- since I am running it on a one minute chart then the start becomes different when you refresh.
🧠 Price Action
Price action is the study of how price moves on a chart — without relying on indicators. If you master price action, you can trade confidently even without indicators — because you’ll understand what the market is telling you through structure, momentum, and liquidity.
How to Read Price Action Step by Step
Identify Market Structure
→ Are we trending or ranging?
Mark Key Levels
→ Swing highs/lows, supply/demand, liquidity zones.
Wait for Confirmation
→ BOS / CHoCH or rejection candles.
Align With Context
→ Where are we in the larger timeframe? (Top-down analysis)
Enter on Reaction
→ Wait for a clear rejection, engulfing candle, or BOS confirmation near your zone.
Manage Risk
→ Stop-loss below swing (for longs) or above swing (for shorts).
Having a good strategy is essential, but it’s only one piece of the puzzle. To be a consistently successful trader, you need a combination of psychology, risk management, discipline, and process — the things that keep you profitable when the strategy itself faces drawdowns.
1. Trading Psychology 🧠
2. Risk & Money Management 💵
3. Trading Plan & Strategy 📈
4. Discipline & Consistency 🧩
5. Continuous Learning & Review 🔍
💬 Final Thought
“Indicators follow price.
Price follows order flow.
To understand order flow — study price action.
⚠️ Disclaimer:
This indicator is intended for educational purposes only and should not be considered financial advice. Always use proper risk management.
"Trading involves risk. Trade responsibly.
No indicator gives 100% accurate signals."
Please forward test first and use at your own risk.
If you spot repaint issues, please Read the the Limitations again.
I have spent quite a bit of time and I figured I would put it out to the community to share the work.
Ok, so let me say that I have spent some amount of time to make the indicator/Strategy not to repaint while still maintaining it's profitability. It has been a challenge so I am publishing.
What I have observed: the strategy will not repaint in real time.
Channel Balance
Bright Magenta Upper (Supply) side with Standard Deviation Interpretation +1σ, +2σ, +3σ above the mean — statistically “overbought” areas where price may reverse or slow down
Bright Cyan Lower (Demand) side with Standard Deviation Interpretation −1σ, −2σ, −3σ below the mean — “oversold” areas where buying interest may return
Supply Zone ---->> Resistance / Sell area
Demand Zone ------>> Support / Buy area
BOS ----->> Market structure break
Buy/Long markers ----->> Potential entry for long trades
Sell/Short markers ----->> Potential entry for short trades
Limitation on lower timeframe chart
That is, if you have the chart open and keep it open, the signals are the same as the ones that are sent out by the strategy. In certain cases, when I reload the chart- the signals might be off from what was sent. In some ways, that is repainting, but it is repainting based on losing the real time data and recalculating from a different set of bars- since I am running it on a one minute chart then the start becomes different when you refresh.
🧠 Price Action
Price action is the study of how price moves on a chart — without relying on indicators. If you master price action, you can trade confidently even without indicators — because you’ll understand what the market is telling you through structure, momentum, and liquidity.
How to Read Price Action Step by Step
Identify Market Structure
→ Are we trending or ranging?
Mark Key Levels
→ Swing highs/lows, supply/demand, liquidity zones.
Wait for Confirmation
→ BOS / CHoCH or rejection candles.
Align With Context
→ Where are we in the larger timeframe? (Top-down analysis)
Enter on Reaction
→ Wait for a clear rejection, engulfing candle, or BOS confirmation near your zone.
Manage Risk
→ Stop-loss below swing (for longs) or above swing (for shorts).
Having a good strategy is essential, but it’s only one piece of the puzzle. To be a consistently successful trader, you need a combination of psychology, risk management, discipline, and process — the things that keep you profitable when the strategy itself faces drawdowns.
1. Trading Psychology 🧠
2. Risk & Money Management 💵
3. Trading Plan & Strategy 📈
4. Discipline & Consistency 🧩
5. Continuous Learning & Review 🔍
💬 Final Thought
“Indicators follow price.
Price follows order flow.
To understand order flow — study price action.
⚠️ Disclaimer:
This indicator is intended for educational purposes only and should not be considered financial advice. Always use proper risk management.
"Trading involves risk. Trade responsibly.
No indicator gives 100% accurate signals."
Please forward test first and use at your own risk.
If you spot repaint issues, please Read the the Limitations again.
릴리즈 노트
Fix초대 전용 스크립트
이 스크립트는 작성자가 승인한 사용자만 접근할 수 있습니다. 사용하려면 요청을 보내고 승인을 받아야 합니다. 일반적으로 결제 후에 승인이 이루어집니다. 자세한 내용은 아래 작성자의 지침을 따르거나 ViniReddy에게 직접 문의하세요.
트레이딩뷰는 스크립트 작성자를 완전히 신뢰하고 스크립트 작동 방식을 이해하지 않는 한 스크립트 비용을 지불하거나 사용하지 않는 것을 권장하지 않습니다. 무료 오픈소스 대체 스크립트는 커뮤니티 스크립트에서 찾을 수 있습니다.
작성자 지시 사항
This indicator combines Supply-Demand zones, Break of Structure (BOS), and
Standard Deviation volatility bands to identify potential reversal and continuation
areas on specific timeframe.
Works best on Gold, Crypto, Indices, and major Forex pairs.
면책사항
이 정보와 게시물은 TradingView에서 제공하거나 보증하는 금융, 투자, 거래 또는 기타 유형의 조언이나 권고 사항을 의미하거나 구성하지 않습니다. 자세한 내용은 이용 약관을 참고하세요.
초대 전용 스크립트
이 스크립트는 작성자가 승인한 사용자만 접근할 수 있습니다. 사용하려면 요청을 보내고 승인을 받아야 합니다. 일반적으로 결제 후에 승인이 이루어집니다. 자세한 내용은 아래 작성자의 지침을 따르거나 ViniReddy에게 직접 문의하세요.
트레이딩뷰는 스크립트 작성자를 완전히 신뢰하고 스크립트 작동 방식을 이해하지 않는 한 스크립트 비용을 지불하거나 사용하지 않는 것을 권장하지 않습니다. 무료 오픈소스 대체 스크립트는 커뮤니티 스크립트에서 찾을 수 있습니다.
작성자 지시 사항
This indicator combines Supply-Demand zones, Break of Structure (BOS), and
Standard Deviation volatility bands to identify potential reversal and continuation
areas on specific timeframe.
Works best on Gold, Crypto, Indices, and major Forex pairs.
면책사항
이 정보와 게시물은 TradingView에서 제공하거나 보증하는 금융, 투자, 거래 또는 기타 유형의 조언이나 권고 사항을 의미하거나 구성하지 않습니다. 자세한 내용은 이용 약관을 참고하세요.