PROTECTED SOURCE SCRIPT
Alt Chart Divergence
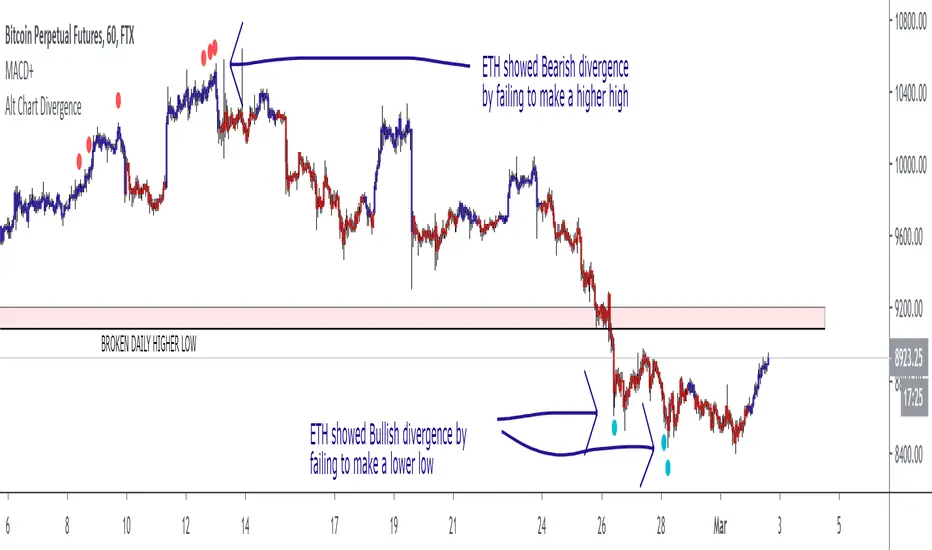
This script is designed to allow you to view bullish or bearish divergences between Bitcoin and ETH or an other alt of choice. However, you could also apply the idea in reverse or use it to look at chart comparisons such as DJI vs SPX or XAU vs XAG or UKOIL vs USOIL. Any alternate ticker can be used to plot divergences on the primary ticker treating the alternate chart as an indicator.
The design is very simple, just showing a dot for each case of bullish or bearish divergence.
The design is very simple, just showing a dot for each case of bullish or bearish divergence.
보호된 스크립트입니다
이 스크립트는 비공개 소스로 게시됩니다. 하지만 이를 자유롭게 제한 없이 사용할 수 있습니다 – 자세한 내용은 여기에서 확인하세요.
면책사항
해당 정보와 게시물은 금융, 투자, 트레이딩 또는 기타 유형의 조언이나 권장 사항으로 간주되지 않으며, 트레이딩뷰에서 제공하거나 보증하는 것이 아닙니다. 자세한 내용은 이용 약관을 참조하세요.
면책사항
해당 정보와 게시물은 금융, 투자, 트레이딩 또는 기타 유형의 조언이나 권장 사항으로 간주되지 않으며, 트레이딩뷰에서 제공하거나 보증하는 것이 아닙니다. 자세한 내용은 이용 약관을 참조하세요.