OPEN-SOURCE SCRIPT
ChArt Path

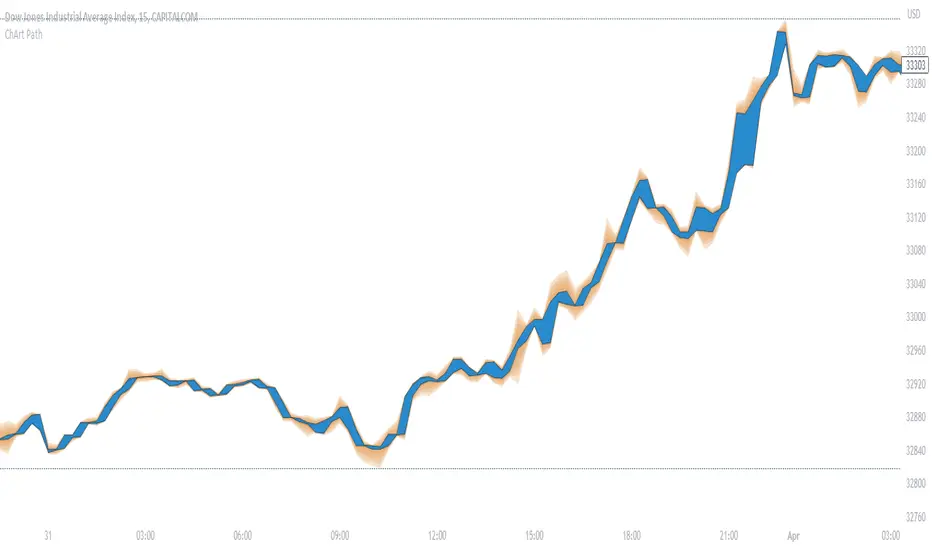
"ChArt Path" shows the same datas as the candles, but as a channel, instead of individual candles.
It allows to focus on the direction of the price (instead of wondering the meaning of each candle), which hopefully simplifies the analysis, and reduces the confusion.
Also, it is artistically customizable!
A little time might be necessary to get used to this indicator.
NOTES FOR INSTALLATION:
- Japanese candles might be more expressive than Heiken Ashi, with this indicator.
- Hide the candles in the chart settings (right click on an empty space in the chart, then "Settings", "Symbol", and uncheck "Body", "Borders" and "Wick").
- Add "ChArt Path" to the chart.
- In the indicator's settings, choose the options you prefer. The Advanced setting are tuned by default for dark themes (bgcolor: black/#0a0c12). Feel free to make them your own!
HOW TO READ THE CHART?
- The path is between 2 borders (black by default) that represent the body of the candle (without the wicks).
- The wicks are represented around the path, as a gradient. This makes a price rejection very easy to spot, as a spike for ex.

SETTINGS
The standard settings are simple. You can pick 2 colors (bullish and bearish) for the path. And 1 color for the wicks.
The advanced settings let you customize the wicks' colors and opacity. You can also activate the gradient of volumes inside the path, to indicate the volume behind each candle.
HOW TO USE CHART PATH?
I use it on 2 timeframes (direction/entry), both with FREMA Trend (See below).
When there is a wick spike (price rejection), followed by an arrow signal in FREMA Trend, then there might be an opportunity. I look for confirmations from different origins, like volume, momentum, and cycles.

DO NOT BASE YOUR TRADING DECISIONS ON 1 SINGLE INDICATOR'S SIGNALS.
Always confirm your ideas by other means, like price action and indicators of a different nature.
NOTES ABOUT THE GRADIENT OF VOLUMES:
The more intense is the color, the bigger is the volume.
The unit is a 400 periods moving average of the volumes, considered as 1 volume.
Each color represents half of this volume. For ex: Grays indicate under (or equal) to the 400 MA (low volumes). Bright yellow represents above 7 times the 400 MA (very high volumes).
When there's no available volume datas, the candles turn bright green by default.
It allows to focus on the direction of the price (instead of wondering the meaning of each candle), which hopefully simplifies the analysis, and reduces the confusion.
Also, it is artistically customizable!
A little time might be necessary to get used to this indicator.
NOTES FOR INSTALLATION:
- Japanese candles might be more expressive than Heiken Ashi, with this indicator.
- Hide the candles in the chart settings (right click on an empty space in the chart, then "Settings", "Symbol", and uncheck "Body", "Borders" and "Wick").
- Add "ChArt Path" to the chart.
- In the indicator's settings, choose the options you prefer. The Advanced setting are tuned by default for dark themes (bgcolor: black/#0a0c12). Feel free to make them your own!
HOW TO READ THE CHART?
- The path is between 2 borders (black by default) that represent the body of the candle (without the wicks).
- The wicks are represented around the path, as a gradient. This makes a price rejection very easy to spot, as a spike for ex.
SETTINGS
The standard settings are simple. You can pick 2 colors (bullish and bearish) for the path. And 1 color for the wicks.
The advanced settings let you customize the wicks' colors and opacity. You can also activate the gradient of volumes inside the path, to indicate the volume behind each candle.
HOW TO USE CHART PATH?
I use it on 2 timeframes (direction/entry), both with FREMA Trend (See below).

When there is a wick spike (price rejection), followed by an arrow signal in FREMA Trend, then there might be an opportunity. I look for confirmations from different origins, like volume, momentum, and cycles.
DO NOT BASE YOUR TRADING DECISIONS ON 1 SINGLE INDICATOR'S SIGNALS.
Always confirm your ideas by other means, like price action and indicators of a different nature.
NOTES ABOUT THE GRADIENT OF VOLUMES:
The more intense is the color, the bigger is the volume.
The unit is a 400 periods moving average of the volumes, considered as 1 volume.
Each color represents half of this volume. For ex: Grays indicate under (or equal) to the 400 MA (low volumes). Bright yellow represents above 7 times the 400 MA (very high volumes).
When there's no available volume datas, the candles turn bright green by default.
오픈 소스 스크립트
트레이딩뷰의 진정한 정신에 따라, 이 스크립트의 작성자는 이를 오픈소스로 공개하여 트레이더들이 기능을 검토하고 검증할 수 있도록 했습니다. 작성자에게 찬사를 보냅니다! 이 코드는 무료로 사용할 수 있지만, 코드를 재게시하는 경우 하우스 룰이 적용된다는 점을 기억하세요.
면책사항
해당 정보와 게시물은 금융, 투자, 트레이딩 또는 기타 유형의 조언이나 권장 사항으로 간주되지 않으며, 트레이딩뷰에서 제공하거나 보증하는 것이 아닙니다. 자세한 내용은 이용 약관을 참조하세요.
오픈 소스 스크립트
트레이딩뷰의 진정한 정신에 따라, 이 스크립트의 작성자는 이를 오픈소스로 공개하여 트레이더들이 기능을 검토하고 검증할 수 있도록 했습니다. 작성자에게 찬사를 보냅니다! 이 코드는 무료로 사용할 수 있지만, 코드를 재게시하는 경우 하우스 룰이 적용된다는 점을 기억하세요.
면책사항
해당 정보와 게시물은 금융, 투자, 트레이딩 또는 기타 유형의 조언이나 권장 사항으로 간주되지 않으며, 트레이딩뷰에서 제공하거나 보증하는 것이 아닙니다. 자세한 내용은 이용 약관을 참조하세요.