OPEN-SOURCE SCRIPT
Taylor True Ranges - deviations

Description:
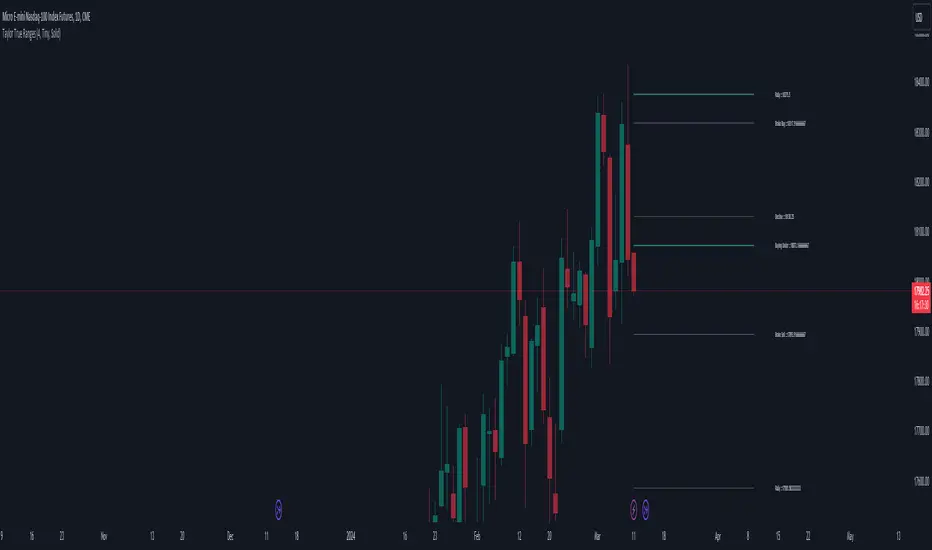
The Taylor True Ranges - Deviations indicator in Pine Script 5.0 computes various price levels and averages based on Taylor's trading principles. It provides insights into potential buying and selling opportunities by analyzing deviations from average price movements. The indicator calculates and visualizes critical levels such as Decline Average, Buying Under Average, Pivot Brake Sell, Rally Average, Buying High Average, and Pivot Brake Buy. These levels are derived from historical price data and help traders identify key support and resistance zones, trend reversals, and breakout points.
Key Features:
Taylor's Trading Principles: The indicator implements Taylor's methodology to analyze price movements and identify trading opportunities based on deviations from average ranges.
Multiple Price Levels: It calculates and displays various price levels, including Decline Average, Buying Under Average, Pivot Brake Sell, Rally Average, Buying High Average, and Pivot Brake Buy.
Customizable Visualization: Traders can customize the visualization by toggling the display of individual price levels and adjusting the appearance settings such as line style, color, and text size.
Daily Lookback: The indicator supports a customizable daily lookback period, allowing traders to analyze historical price movements over a specified timeframe.
Usage:
Apply the Taylor True Ranges - Deviations indicator to your chart to analyze deviations from average price movements and identify potential trading opportunities.
Customize the indicator settings, including the daily lookback period, line style, color, and text size, to suit your trading preferences and analysis requirements.
Use the calculated price levels and averages as part of your technical analysis to make informed trading decisions, including identifying support and resistance levels, trend reversals, and breakout points.
Example:
Traders can use the Taylor True Ranges - Deviations indicator to analyze deviations from average price movements and identify key support and resistance levels. For instance, observing a Pivot Brake Sell level crossing above the current price might indicate a potential selling opportunity, while a Pivot Brake Buy level crossing below the price could signal a buying opportunity.
오픈 소스 스크립트
트레이딩뷰의 진정한 정신에 따라, 이 스크립트의 작성자는 이를 오픈소스로 공개하여 트레이더들이 기능을 검토하고 검증할 수 있도록 했습니다. 작성자에게 찬사를 보냅니다! 이 코드는 무료로 사용할 수 있지만, 코드를 재게시하는 경우 하우스 룰이 적용된다는 점을 기억하세요.
면책사항
해당 정보와 게시물은 금융, 투자, 트레이딩 또는 기타 유형의 조언이나 권장 사항으로 간주되지 않으며, 트레이딩뷰에서 제공하거나 보증하는 것이 아닙니다. 자세한 내용은 이용 약관을 참조하세요.
오픈 소스 스크립트
트레이딩뷰의 진정한 정신에 따라, 이 스크립트의 작성자는 이를 오픈소스로 공개하여 트레이더들이 기능을 검토하고 검증할 수 있도록 했습니다. 작성자에게 찬사를 보냅니다! 이 코드는 무료로 사용할 수 있지만, 코드를 재게시하는 경우 하우스 룰이 적용된다는 점을 기억하세요.
면책사항
해당 정보와 게시물은 금융, 투자, 트레이딩 또는 기타 유형의 조언이나 권장 사항으로 간주되지 않으며, 트레이딩뷰에서 제공하거나 보증하는 것이 아닙니다. 자세한 내용은 이용 약관을 참조하세요.