OPEN-SOURCE SCRIPT
업데이트됨 Constance Brown RSI
*Re-uploading without House Violations*
Welles Wilder created the RSI momentum oscillator in the 1970s. It is a momentum oscillator that ranges from 0 to 100. The traditional idea is to buy when the oscillator is below 30 and to sell when it is above 70. However, this strategy often only catches extreme moves and misses majority of the trend.
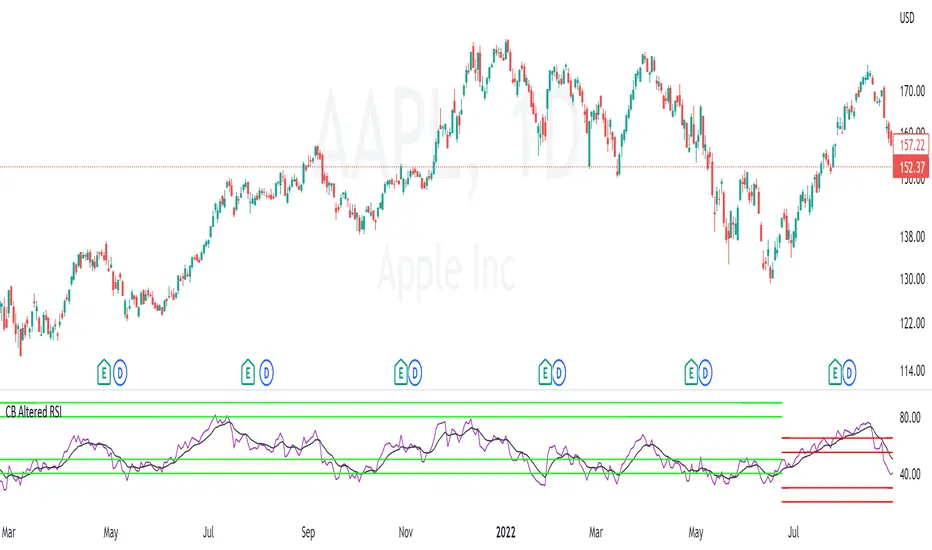
In comes Constance Brown RSI . She theorized that in an uptrend, the buy zone exists when RSI is between 40 and 50. The sell zone in an uptrend exists between 80 and 90. In a downtrend, the sell zone exists between 55 and 65. The buy zone in a downtrend exists between 20 and 30.
I have added a moving average feature to determine trend. When the short trend is above the long trend, it is considered an uptrend. It is in a downtrend otherwise. Using short length moving averages will often produce a lot of false signals. I recommend using the 50 and 100 as they will produce less noise.
There will be times when the oscillator breaks beyond the ranges described (for ex: seeing a reading below 40 in an uptrend). This tends to happen in periods of high volatility . Refer to the traditional RSI rules in such cases.
https://www.tradingview.com/x/of8R82ie
Welles Wilder created the RSI momentum oscillator in the 1970s. It is a momentum oscillator that ranges from 0 to 100. The traditional idea is to buy when the oscillator is below 30 and to sell when it is above 70. However, this strategy often only catches extreme moves and misses majority of the trend.
In comes Constance Brown RSI . She theorized that in an uptrend, the buy zone exists when RSI is between 40 and 50. The sell zone in an uptrend exists between 80 and 90. In a downtrend, the sell zone exists between 55 and 65. The buy zone in a downtrend exists between 20 and 30.
I have added a moving average feature to determine trend. When the short trend is above the long trend, it is considered an uptrend. It is in a downtrend otherwise. Using short length moving averages will often produce a lot of false signals. I recommend using the 50 and 100 as they will produce less noise.
There will be times when the oscillator breaks beyond the ranges described (for ex: seeing a reading below 40 in an uptrend). This tends to happen in periods of high volatility . Refer to the traditional RSI rules in such cases.
https://www.tradingview.com/x/of8R82ie
릴리즈 노트
Added an EMA signal line. Buy the crossover from the support zone in an uptrend and sell the crossunder from the resistance zone in a downtrend. 오픈 소스 스크립트
트레이딩뷰의 진정한 정신에 따라, 이 스크립트의 작성자는 이를 오픈소스로 공개하여 트레이더들이 기능을 검토하고 검증할 수 있도록 했습니다. 작성자에게 찬사를 보냅니다! 이 코드는 무료로 사용할 수 있지만, 코드를 재게시하는 경우 하우스 룰이 적용된다는 점을 기억하세요.
면책사항
해당 정보와 게시물은 금융, 투자, 트레이딩 또는 기타 유형의 조언이나 권장 사항으로 간주되지 않으며, 트레이딩뷰에서 제공하거나 보증하는 것이 아닙니다. 자세한 내용은 이용 약관을 참조하세요.
오픈 소스 스크립트
트레이딩뷰의 진정한 정신에 따라, 이 스크립트의 작성자는 이를 오픈소스로 공개하여 트레이더들이 기능을 검토하고 검증할 수 있도록 했습니다. 작성자에게 찬사를 보냅니다! 이 코드는 무료로 사용할 수 있지만, 코드를 재게시하는 경우 하우스 룰이 적용된다는 점을 기억하세요.
면책사항
해당 정보와 게시물은 금융, 투자, 트레이딩 또는 기타 유형의 조언이나 권장 사항으로 간주되지 않으며, 트레이딩뷰에서 제공하거나 보증하는 것이 아닙니다. 자세한 내용은 이용 약관을 참조하세요.