INVITE-ONLY SCRIPT
Custom Fibonacci Support & Resistance Lines

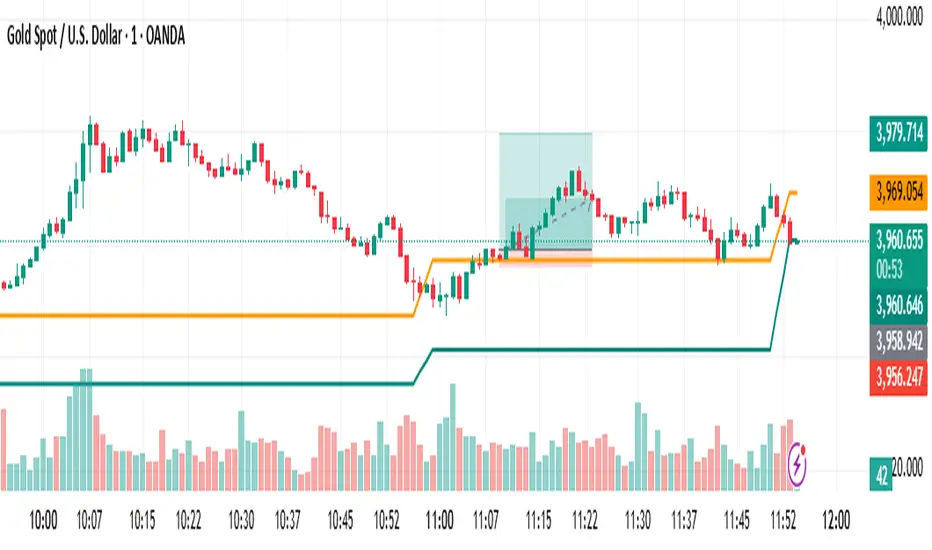
Custom Fibonacci Support & Resistance Lines automatically plots dynamic 0.618-style Fibonacci levels based on recent swing highs and lows.
The script detects the latest confirmed swing high and swing low on the chart and calculates two adaptive lines:
A Fibonacci Support Line below price (retracement from swing high to swing low).
A Fibonacci Resistance Line above price (retracement from swing low to swing high).
Both levels are smoothed using a simple moving average for a cleaner visual appearance — similar to an adaptive support/resistance band that follows recent market structure.
⚙️ Features
🔹 Auto-detects swing highs & lows using left/right bar pivots.
🔹 Adjustable Fibonacci levels for both Support and Resistance.
🔹 Adjustable smoothing length for smoother or more reactive lines.
🔹 Works across any timeframe and instrument.
🔹 Ideal for spotting potential reversal zones, trend continuation areas, and dynamic price support/resistance.
🧮 Default Settings
Fibonacci Level (Support) = 0.618
Fibonacci Level (Resistance) = 0.618
Left/Right Swing Bars = 5 / 5
Smoothing Length = 3
💡 Usage Tips
Combine these dynamic Fibonacci lines with trend indicators (EMA, RSI, or structure breaks) to confirm entries.
Increase Left/Right Swing Bars for stronger structural pivots on higher timeframes.
Change Fibonacci Levels (e.g., 0.382, 0.5, 0.786) to visualize multiple retracement zones.
초대 전용 스크립트
이 스크립트는 작성자가 승인한 사용자만 접근할 수 있습니다. 사용하려면 요청을 보내고 승인을 받아야 합니다. 일반적으로 결제 후에 승인이 이루어집니다. 자세한 내용은 아래 작성자의 지침을 따르거나 ChartTechnical에게 직접 문의하세요.
트레이딩뷰는 스크립트 작성자를 완전히 신뢰하고 스크립트 작동 방식을 이해하지 않는 한 스크립트 비용을 지불하거나 사용하지 않는 것을 권장하지 않습니다. 무료 오픈소스 대체 스크립트는 커뮤니티 스크립트에서 찾을 수 있습니다.
작성자 지시 사항
drop a message to me
면책사항
이 정보와 게시물은 TradingView에서 제공하거나 보증하는 금융, 투자, 거래 또는 기타 유형의 조언이나 권고 사항을 의미하거나 구성하지 않습니다. 자세한 내용은 이용 약관을 참고하세요.