OPEN-SOURCE SCRIPT
업데이트됨 Dema DMI | viResearch
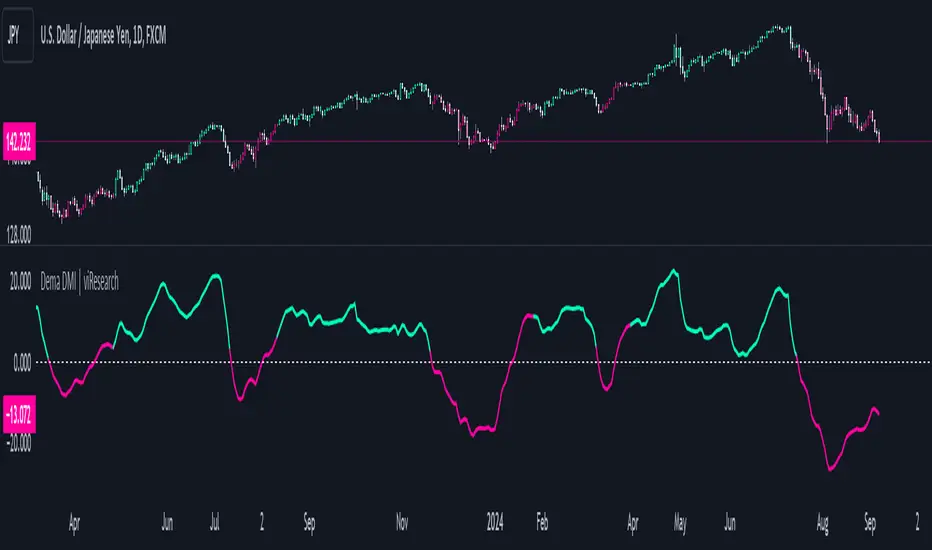
Dema DMI | viResearch
Conceptual Foundation and Innovation
The "Dema DMI" indicator integrates the Double Exponential Moving Average (DEMA) with the Directional Movement Index (DMI), creating a more responsive and precise trend-following system. The DEMA is used to smooth price data while minimizing lag, making it highly effective for trend detection. The DMI, on the other hand, measures the strength and direction of a trend by analyzing positive and negative directional movements. By combining these two elements, the "Dema DMI" offers traders a powerful tool for identifying trend changes and evaluating the strength of ongoing trends. This combination helps filter out noise in price data while maintaining sensitivity to market movements, providing better trend signals and decision-making opportunities.
Technical Composition and Calculation
The "Dema DMI" script uses two main components: the Double Exponential Moving Average (DEMA) and the Directional Movement Index (DMI). The DEMA is applied to both the high and low prices, creating smoothed versions of these prices based on a user-defined length. The DMI is then calculated by comparing changes in the smoothed high and low prices to measure directional movement. Positive directional movement (DM+) and negative directional movement (DM−) are calculated by evaluating whether the price is trending upward or downward, and the Average Directional Index (ADX) is computed to measure the strength of the trend. The ADX is smoothed to provide a more stable signal of trend strength.
Features and User Inputs
The "Dema DMI" script provides several customizable inputs, enabling traders to tailor the indicator to their strategies. The DEMA Length controls the period over which the DEMA is calculated for both high and low prices. The DMI Length sets the window for calculating directional movement, while the ADX Smoothing Length determines how smooth the ADX line appears, making it easier to assess whether a trend is strengthening or weakening. The script also includes customizable bar colors and alert conditions, providing traders with clear visual cues and notifications when a trend change occurs.
Practical Applications
The "Dema DMI" indicator is designed for traders looking to assess trend strength and direction more effectively. The DEMA smooths price movements, while the DMI highlights shifts in directional movement, providing early signals of potential trend reversals. The ADX helps gauge whether a trend is gaining momentum, allowing traders to improve the timing of trade entries and exits. Additionally, the customizable inputs make the indicator adaptable to different market conditions, ensuring its usefulness in both trending and ranging environments.
Advantages and Strategic Value
The "Dema DMI" script offers significant value by merging the smoothing effects of DEMA with the directional analysis of the DMI. This combination reduces the lag commonly associated with trend-following indicators, providing more timely and accurate trend signals. The ADX further enhances the indicator’s utility by measuring the strength of the trend, helping traders filter out weak signals and stay aligned with stronger trends. This makes the "Dema DMI" an ideal tool for traders seeking to improve their trend-following strategies and optimize their market positioning.
Alerts and Visual Cues
The script includes alert conditions that notify traders when a significant trend change occurs. The "Dema DMI Long" alert is triggered when the indicator detects an upward trend, while the "Dema DMI Short" alert signals a potential downward trend. Visual cues, such as changes in the bar color and the difference between positive and negative directional movement, help traders quickly identify trend shifts and act accordingly.
Summary and Usage Tips
The "Dema DMI | viResearch" indicator combines the smoothing benefits of the DEMA with the directional analysis of the DMI, providing traders with a reliable tool for detecting trend changes and confirming trend strength. By incorporating this script into your trading strategy, you can improve your ability to detect early trend reversals, confirm trend direction, and reduce noise in price data. The "Dema DMI" is a flexible and adaptable solution for traders looking to enhance their technical analysis in various market conditions.
Note: Backtests are based on past results and are not indicative of future performance.
릴리즈 노트
update| dema plotting릴리즈 노트
update| dema plot릴리즈 노트
updated| remove dema plotting to avoid confusion오픈 소스 스크립트
트레이딩뷰의 진정한 정신에 따라, 이 스크립트의 작성자는 이를 오픈소스로 공개하여 트레이더들이 기능을 검토하고 검증할 수 있도록 했습니다. 작성자에게 찬사를 보냅니다! 이 코드는 무료로 사용할 수 있지만, 코드를 재게시하는 경우 하우스 룰이 적용된다는 점을 기억하세요.
면책사항
해당 정보와 게시물은 금융, 투자, 트레이딩 또는 기타 유형의 조언이나 권장 사항으로 간주되지 않으며, 트레이딩뷰에서 제공하거나 보증하는 것이 아닙니다. 자세한 내용은 이용 약관을 참조하세요.
오픈 소스 스크립트
트레이딩뷰의 진정한 정신에 따라, 이 스크립트의 작성자는 이를 오픈소스로 공개하여 트레이더들이 기능을 검토하고 검증할 수 있도록 했습니다. 작성자에게 찬사를 보냅니다! 이 코드는 무료로 사용할 수 있지만, 코드를 재게시하는 경우 하우스 룰이 적용된다는 점을 기억하세요.
면책사항
해당 정보와 게시물은 금융, 투자, 트레이딩 또는 기타 유형의 조언이나 권장 사항으로 간주되지 않으며, 트레이딩뷰에서 제공하거나 보증하는 것이 아닙니다. 자세한 내용은 이용 약관을 참조하세요.