OPEN-SOURCE SCRIPT
Zone Color Pattern
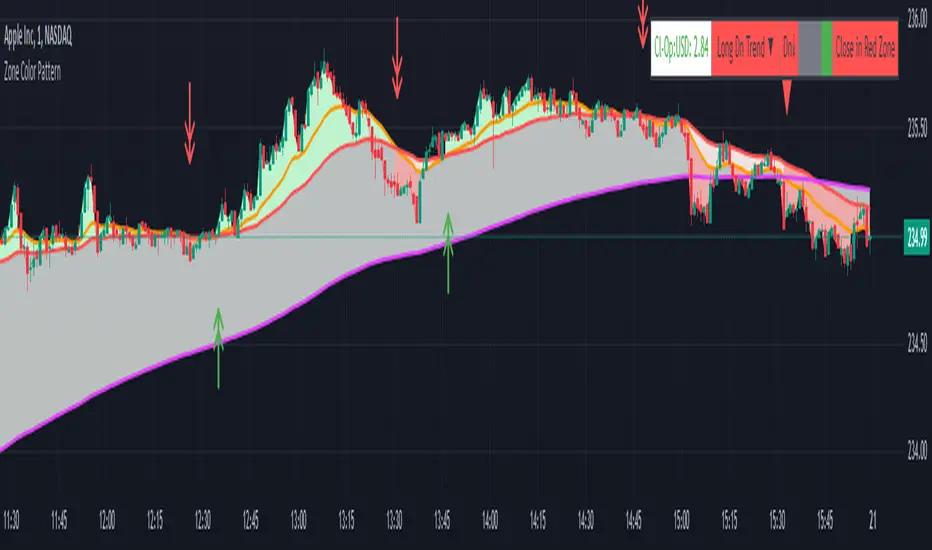
Zone Color Pattern indicator depicts the color pattern of zones on chart. This will help the user to identify the zones on Chart.
Green Zone is indicated by Green color.
Red Zone is indicated by Red Color.
Gray Zone is indicated by Gray Zone.
Zone Color Pattern indicator is based on 3 moving averages. Long term, Medium term and Short Term.By default they are 200, 50 and 20.
When you are on long term trend the position of MAs is 20 MA is on top,then comes 50 MA and 200 MA is positioned below 50 MA.The position of respective MAs change during down trend.
The color patterns display the distance between different MAs .The widening and contraction of space between different Moving Averages indicate the movement and direction of price.
Basically price tend to move in and move away from Average. This action tend to create a space between price and MAs.Color patterns between price and MAs reflect the gap between the price and M|As .All these effects can be visualized on chart in relevant colors to infer the status of price, movement, cross over by the User.
Buy trades are preferred when close is in Green Zone and price is above MA20.
Sell trades are preferred when close is in Red Zone and price is below MA20
Trades may be avoided when close is in Gray Zone.
Long Up Trend and Down Trend respective color triangle shapes and arrows on chart indicate the trends and direction.
The chart understanding has to be supplemented with other regular indicators along with appropriate risk reward techniques by user.
Table indicate difference between Last Price traded and Day open price.
Other columns in table display the position of close in different Zones.
DISCLAIMER: For educational and entertainment purpose only .Nothing in this content should be interpreted as financial advice or a recommendation to buy or sell any sort of security/ies or investment/s.
오픈 소스 스크립트
트레이딩뷰의 진정한 정신에 따라, 이 스크립트의 작성자는 이를 오픈소스로 공개하여 트레이더들이 기능을 검토하고 검증할 수 있도록 했습니다. 작성자에게 찬사를 보냅니다! 이 코드는 무료로 사용할 수 있지만, 코드를 재게시하는 경우 하우스 룰이 적용된다는 점을 기억하세요.
면책사항
해당 정보와 게시물은 금융, 투자, 트레이딩 또는 기타 유형의 조언이나 권장 사항으로 간주되지 않으며, 트레이딩뷰에서 제공하거나 보증하는 것이 아닙니다. 자세한 내용은 이용 약관을 참조하세요.
오픈 소스 스크립트
트레이딩뷰의 진정한 정신에 따라, 이 스크립트의 작성자는 이를 오픈소스로 공개하여 트레이더들이 기능을 검토하고 검증할 수 있도록 했습니다. 작성자에게 찬사를 보냅니다! 이 코드는 무료로 사용할 수 있지만, 코드를 재게시하는 경우 하우스 룰이 적용된다는 점을 기억하세요.
면책사항
해당 정보와 게시물은 금융, 투자, 트레이딩 또는 기타 유형의 조언이나 권장 사항으로 간주되지 않으며, 트레이딩뷰에서 제공하거나 보증하는 것이 아닙니다. 자세한 내용은 이용 약관을 참조하세요.