OPEN-SOURCE SCRIPT
Market Health Oscillator
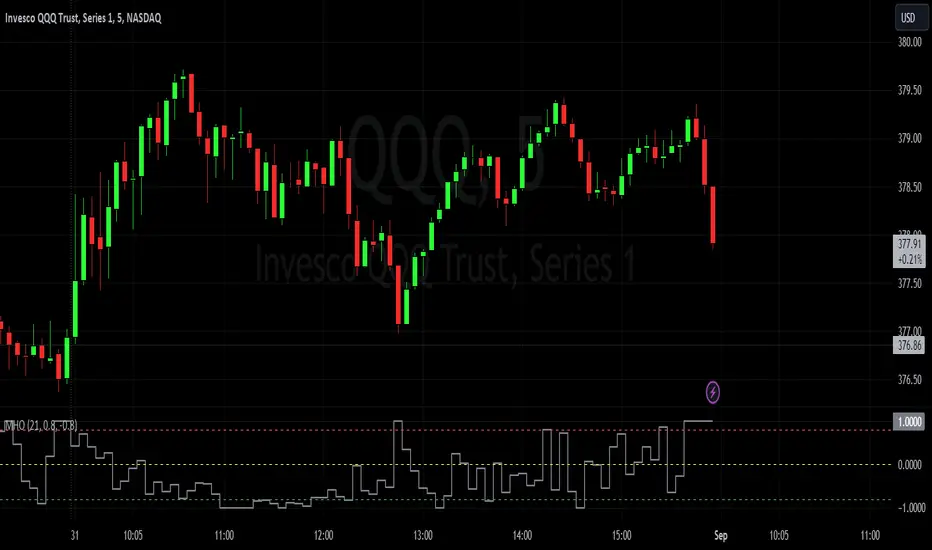
Designed to provide traders with a comprehensive view of the overall health of a market. By combining the rate of change of key indicators, the MHO offers insight into potential shifts in market sentiment.
Components:
Price Rate of Change: The MHO considers the rate of change of the price of an asset over a specified period. This element reflects the momentum of the asset's price movement, aiding in the assessment of potential trend shifts.
Volume Rate of Change: Tracking the rate of change of trading volume provides insights into market participation and interest. Changes in volume can signify shifts in market sentiment and potential trend reversals.
Volatility Rate of Change: The rate of change of volatility, often measured using the Average True Range (ATR), helps gauge the level of uncertainty in the market. An increase in volatility can indicate heightened market activity and potential reversals.
Advance-Decline Line: The MHO takes into account the Advance-Decline Line, which compares the number of advancing stocks to declining stocks. This component offers insights into market breadth and the underlying strength of the current trend.
Calculation and Interpretation:
The MHO aggregates the rate of change of these components and combines them to provide a single oscillator reading. This reading is then normalized to a range between -1 and 1. Positive values suggest bullish market health, while negative values indicate bearish conditions. The oscillator's extremes, coupled with divergence patterns, can signal potential market turning points.
Application:
Identify potential trend reversals or corrections by watching for extreme MHO readings.
Assess the overall health of a market by observing the general direction and amplitude of the oscillator.
Look for divergences between price and the MHO for insights into potential shifts in market sentiment.
This was inspired to offer a holistic perspective on market dynamics. By encompassing price, volume, volatility, and breadth factors, the MHO assists in a comprehensive assessment of market health.
오픈 소스 스크립트
트레이딩뷰의 진정한 정신에 따라, 이 스크립트의 작성자는 이를 오픈소스로 공개하여 트레이더들이 기능을 검토하고 검증할 수 있도록 했습니다. 작성자에게 찬사를 보냅니다! 이 코드는 무료로 사용할 수 있지만, 코드를 재게시하는 경우 하우스 룰이 적용된다는 점을 기억하세요.
KP
면책사항
해당 정보와 게시물은 금융, 투자, 트레이딩 또는 기타 유형의 조언이나 권장 사항으로 간주되지 않으며, 트레이딩뷰에서 제공하거나 보증하는 것이 아닙니다. 자세한 내용은 이용 약관을 참조하세요.
오픈 소스 스크립트
트레이딩뷰의 진정한 정신에 따라, 이 스크립트의 작성자는 이를 오픈소스로 공개하여 트레이더들이 기능을 검토하고 검증할 수 있도록 했습니다. 작성자에게 찬사를 보냅니다! 이 코드는 무료로 사용할 수 있지만, 코드를 재게시하는 경우 하우스 룰이 적용된다는 점을 기억하세요.
KP
면책사항
해당 정보와 게시물은 금융, 투자, 트레이딩 또는 기타 유형의 조언이나 권장 사항으로 간주되지 않으며, 트레이딩뷰에서 제공하거나 보증하는 것이 아닙니다. 자세한 내용은 이용 약관을 참조하세요.