PROTECTED SOURCE SCRIPT
업데이트됨 IKH Signals v2
Ichimoku Kinko Hyo Signals
This script show signals based on my understanding in Ichimoku Kinko Hyo and is an evolution of this script
Instead of using my own functions, I use now the ones provided by pine script
/!\ Please do not follow signals blindly and always make your own analysis /!\
Signals explanation
How to use it
When a signal is triggered
A signal ( strong or not ) show a new entry point. You can start looking for an entry in lower timeframe according to the signal direction.
A colored bar means that the price is pushing in a direction according to the previous signals, It's a good moment to look for an entry in lower timeframes.
Alerts
You can configure alerts for Strong buy, buy, Strong sell, sell and both exit signals
This script show signals based on my understanding in Ichimoku Kinko Hyo and is an evolution of this script
Instead of using my own functions, I use now the ones provided by pine script
/!\ Please do not follow signals blindly and always make your own analysis /!\
Signals explanation
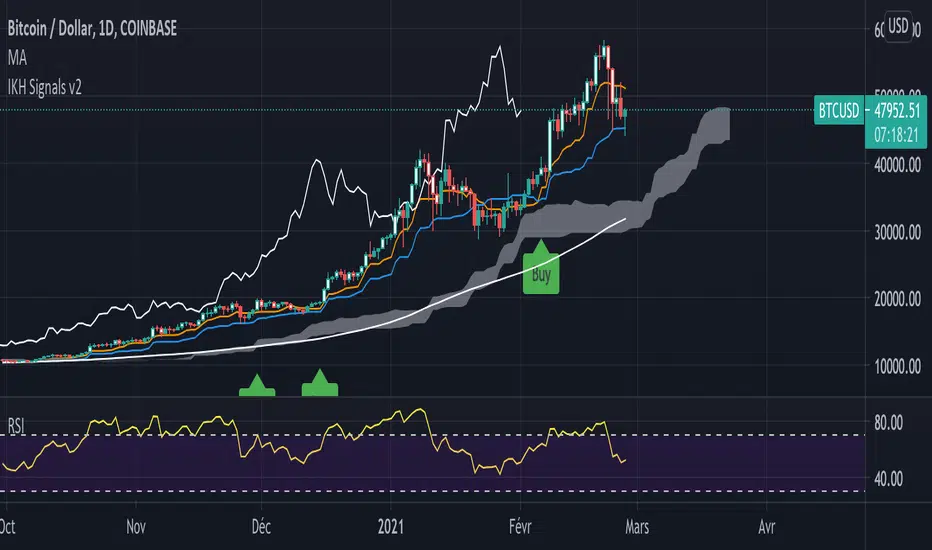
- Buy : Price above kumo, tenkan above kijun, chikou span above candles and kumo and price break previous 9 candles high
- Strong Buy : Is a Sanyaku Kouten and can show a potential reverse in current tendance
- Sell : Price below kumo, tenkan below kijun, chikou span below candles and kumo and price break previous 9 candles low
- Strong Sell : Is a Sanyaku Gyakuten and can show a potential reverse in current tendance
- Exit : Show a potential time to take profit based on previous Sell, Strong Sell, Buy, or Strong Buy signal
- Buy Colored bard : bar a colored between a buy signal and an buy exit signal, based on this conditions : kumo up, SSA or SSB up and kijun up
- Sell Colored bard : bar a colored between a sell signal and an sell exit signal, based on this conditions : kumo down, SSA or SSB down and kijun down
How to use it
When a signal is triggered
A signal ( strong or not ) show a new entry point. You can start looking for an entry in lower timeframe according to the signal direction.
A colored bar means that the price is pushing in a direction according to the previous signals, It's a good moment to look for an entry in lower timeframes.
Alerts
You can configure alerts for Strong buy, buy, Strong sell, sell and both exit signals
릴리즈 노트
Fixe bullish signal보호된 스크립트입니다
이 스크립트는 비공개 소스로 게시됩니다. 하지만 이를 자유롭게 제한 없이 사용할 수 있습니다 – 자세한 내용은 여기에서 확인하세요.
면책사항
해당 정보와 게시물은 금융, 투자, 트레이딩 또는 기타 유형의 조언이나 권장 사항으로 간주되지 않으며, 트레이딩뷰에서 제공하거나 보증하는 것이 아닙니다. 자세한 내용은 이용 약관을 참조하세요.
보호된 스크립트입니다
이 스크립트는 비공개 소스로 게시됩니다. 하지만 이를 자유롭게 제한 없이 사용할 수 있습니다 – 자세한 내용은 여기에서 확인하세요.
면책사항
해당 정보와 게시물은 금융, 투자, 트레이딩 또는 기타 유형의 조언이나 권장 사항으로 간주되지 않으며, 트레이딩뷰에서 제공하거나 보증하는 것이 아닙니다. 자세한 내용은 이용 약관을 참조하세요.