OPEN-SOURCE SCRIPT
업데이트됨 Absorbing System Support and Resistance

Hello Traders :)
I am Only Fibonacci.
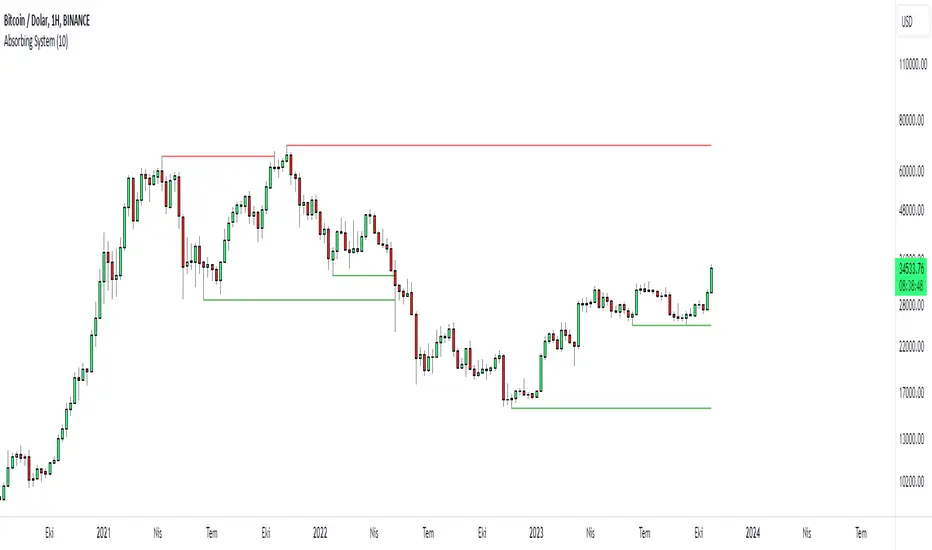
My purpose in coding this indicator was to detect support and resistance more easily.
What is the working principle of this indicator?
This tool detects pivot points.
If the length of the sell pin is higher than the length of the buy pin, it is considered as resistance.
It detects the formation according to the length of the pivot point and draws a line until this level is broken.

The main purpose is to add a new perspective to support and resistance detection and to prepare an educational code sequence.
The codes are open to everyone, you can develop as you wish.
In the settings you can choose whether you want to see the breakdowns, you can also choose whether the breakdowns will be with the wicks or the body.
Pine Script®
It is written in a functional way.
If you call "RES" inside the func method, it draws the resistors. If you throw a call other than "RES" it draws the supports.
The main concept here;
"RES" = Resistance
"SUP" = Support
I am Only Fibonacci.
My purpose in coding this indicator was to detect support and resistance more easily.
What is the working principle of this indicator?
This tool detects pivot points.
If the length of the sell pin is higher than the length of the buy pin, it is considered as resistance.
It detects the formation according to the length of the pivot point and draws a line until this level is broken.
The main purpose is to add a new perspective to support and resistance detection and to prepare an educational code sequence.
The codes are open to everyone, you can develop as you wish.
In the settings you can choose whether you want to see the breakdowns, you can also choose whether the breakdowns will be with the wicks or the body.
func("RES")
func("SUP")
It is written in a functional way.
If you call "RES" inside the func method, it draws the resistors. If you throw a call other than "RES" it draws the supports.
The main concept here;
"RES" = Resistance
"SUP" = Support
릴리즈 노트
Box added.If the box option is active, lines are removed.
Boxes and lines cannot be drawn at the same time.
오픈 소스 스크립트
트레이딩뷰의 진정한 정신에 따라, 이 스크립트의 작성자는 이를 오픈소스로 공개하여 트레이더들이 기능을 검토하고 검증할 수 있도록 했습니다. 작성자에게 찬사를 보냅니다! 이 코드는 무료로 사용할 수 있지만, 코드를 재게시하는 경우 하우스 룰이 적용된다는 점을 기억하세요.
AlgoTrade sevdası.
면책사항
해당 정보와 게시물은 금융, 투자, 트레이딩 또는 기타 유형의 조언이나 권장 사항으로 간주되지 않으며, 트레이딩뷰에서 제공하거나 보증하는 것이 아닙니다. 자세한 내용은 이용 약관을 참조하세요.
오픈 소스 스크립트
트레이딩뷰의 진정한 정신에 따라, 이 스크립트의 작성자는 이를 오픈소스로 공개하여 트레이더들이 기능을 검토하고 검증할 수 있도록 했습니다. 작성자에게 찬사를 보냅니다! 이 코드는 무료로 사용할 수 있지만, 코드를 재게시하는 경우 하우스 룰이 적용된다는 점을 기억하세요.
AlgoTrade sevdası.
면책사항
해당 정보와 게시물은 금융, 투자, 트레이딩 또는 기타 유형의 조언이나 권장 사항으로 간주되지 않으며, 트레이딩뷰에서 제공하거나 보증하는 것이 아닙니다. 자세한 내용은 이용 약관을 참조하세요.