OPEN-SOURCE SCRIPT
업데이트됨 Oscillator Spectrogram
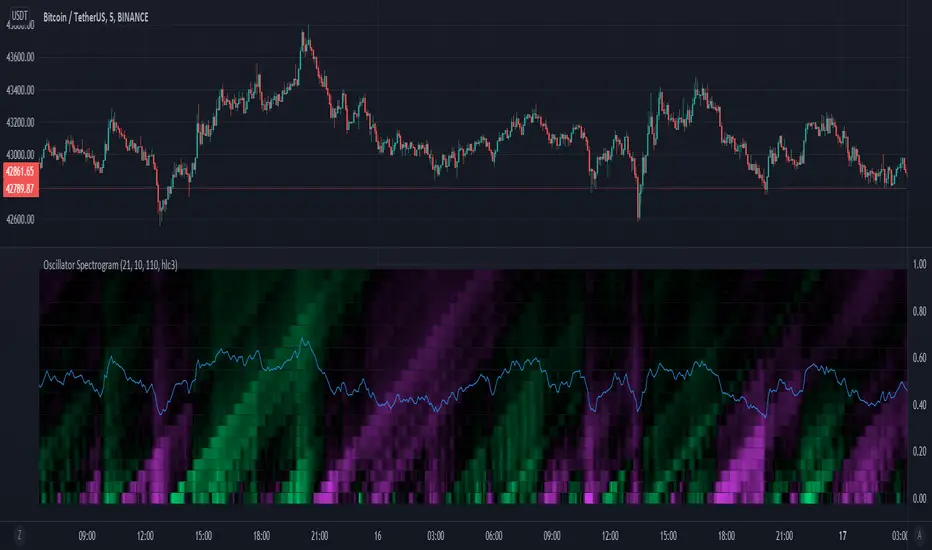
A spectrogram of simple oscillators over varying periods.
Oscillator periods increase from bottom to top.
Color indicates the value of the oscillator, with fuchsia indicating a negative value, black indicating a value around 0, and lime green indicating a value greater than 0.
The oscillators are simply the percentage of positive movement within a lookback period, with 50 percent centered at 0.
Vertical lines along the spectrogram indicate that multiple oscillators of different periods are changing values, indicating a shift in market character.
릴리즈 노트
Added a line representing the average of all the oscillators.릴리즈 노트
Removed accidental chart addition.오픈 소스 스크립트
트레이딩뷰의 진정한 정신에 따라, 이 스크립트의 작성자는 이를 오픈소스로 공개하여 트레이더들이 기능을 검토하고 검증할 수 있도록 했습니다. 작성자에게 찬사를 보냅니다! 이 코드는 무료로 사용할 수 있지만, 코드를 재게시하는 경우 하우스 룰이 적용된다는 점을 기억하세요.
면책사항
해당 정보와 게시물은 금융, 투자, 트레이딩 또는 기타 유형의 조언이나 권장 사항으로 간주되지 않으며, 트레이딩뷰에서 제공하거나 보증하는 것이 아닙니다. 자세한 내용은 이용 약관을 참조하세요.
오픈 소스 스크립트
트레이딩뷰의 진정한 정신에 따라, 이 스크립트의 작성자는 이를 오픈소스로 공개하여 트레이더들이 기능을 검토하고 검증할 수 있도록 했습니다. 작성자에게 찬사를 보냅니다! 이 코드는 무료로 사용할 수 있지만, 코드를 재게시하는 경우 하우스 룰이 적용된다는 점을 기억하세요.
면책사항
해당 정보와 게시물은 금융, 투자, 트레이딩 또는 기타 유형의 조언이나 권장 사항으로 간주되지 않으며, 트레이딩뷰에서 제공하거나 보증하는 것이 아닙니다. 자세한 내용은 이용 약관을 참조하세요.