OPEN-SOURCE SCRIPT
BTC Volatility Forecast
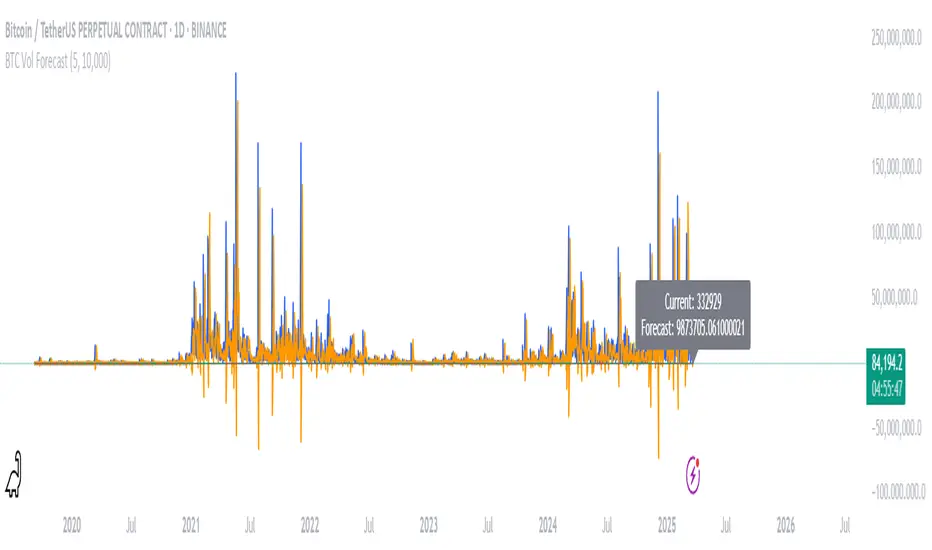
The "BTC Volatility Forecast" indicator is designed to help traders anticipate Bitcoin (BTC) price volatility by analyzing historical daily price ranges and projecting future fluctuations. Inspired by advanced volatility forecasting studies, it calculates an approximate realized variance using the squared difference between each day’s high and low prices. By applying a simple linear regression model over the past five days of variance data (customizable via the "Lag Period" input), the indicator provides a forecast for the next day’s volatility. This makes it a valuable tool for BTC traders looking to gauge potential market turbulence and adjust their strategies accordingly.
On the chart, the indicator displays two lines: a blue solid line representing the current realized variance and an orange line showing the forecasted volatility for the upcoming day. Traders can set a "Volatility Threshold" to trigger alerts when the forecast exceeds a specified level, aiding in risk management or trade planning. A debug label on the last bar also shows the exact current and forecasted values for quick reference. While this version uses daily data for simplicity, it captures the essence of volatility prediction and can be a starting point for understanding BTC market dynamics—perfect for both novice and experienced traders on TradingView.
On the chart, the indicator displays two lines: a blue solid line representing the current realized variance and an orange line showing the forecasted volatility for the upcoming day. Traders can set a "Volatility Threshold" to trigger alerts when the forecast exceeds a specified level, aiding in risk management or trade planning. A debug label on the last bar also shows the exact current and forecasted values for quick reference. While this version uses daily data for simplicity, it captures the essence of volatility prediction and can be a starting point for understanding BTC market dynamics—perfect for both novice and experienced traders on TradingView.
오픈 소스 스크립트
트레이딩뷰의 진정한 정신에 따라, 이 스크립트의 작성자는 이를 오픈소스로 공개하여 트레이더들이 기능을 검토하고 검증할 수 있도록 했습니다. 작성자에게 찬사를 보냅니다! 이 코드는 무료로 사용할 수 있지만, 코드를 재게시하는 경우 하우스 룰이 적용된다는 점을 기억하세요.
면책사항
해당 정보와 게시물은 금융, 투자, 트레이딩 또는 기타 유형의 조언이나 권장 사항으로 간주되지 않으며, 트레이딩뷰에서 제공하거나 보증하는 것이 아닙니다. 자세한 내용은 이용 약관을 참조하세요.
오픈 소스 스크립트
트레이딩뷰의 진정한 정신에 따라, 이 스크립트의 작성자는 이를 오픈소스로 공개하여 트레이더들이 기능을 검토하고 검증할 수 있도록 했습니다. 작성자에게 찬사를 보냅니다! 이 코드는 무료로 사용할 수 있지만, 코드를 재게시하는 경우 하우스 룰이 적용된다는 점을 기억하세요.
면책사항
해당 정보와 게시물은 금융, 투자, 트레이딩 또는 기타 유형의 조언이나 권장 사항으로 간주되지 않으며, 트레이딩뷰에서 제공하거나 보증하는 것이 아닙니다. 자세한 내용은 이용 약관을 참조하세요.