OPEN-SOURCE SCRIPT
업데이트됨 Relative Momentum Index
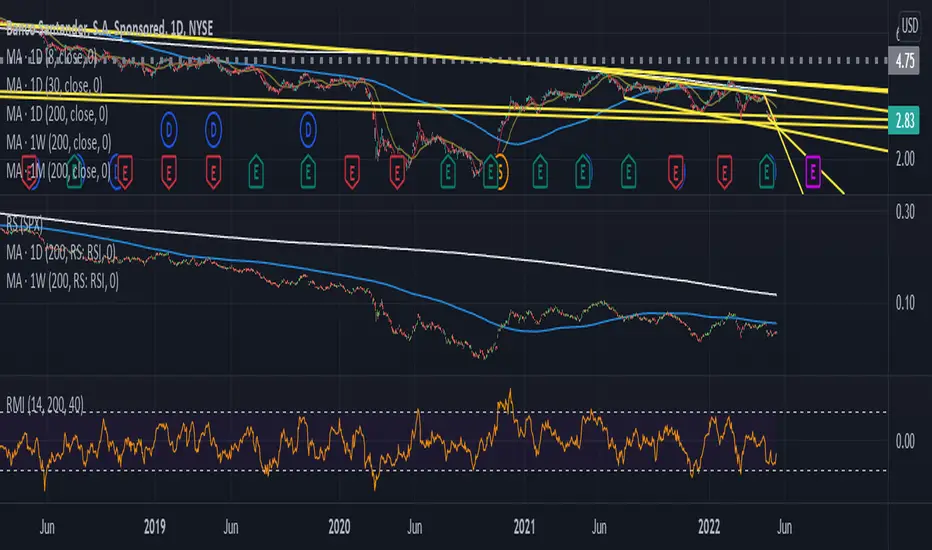
The RMI indicator is intended as a general upgrade to the RSI indicator based on logical improvements to the underlying mathematics of the RSI function.
The first change is that the RMI indicator uses the maximal change in price in both directions rather than simply the change in the closing price to better capture the relative momentum in each direction. The second change is that the the ratio between bullishness and bearishness is passed through a log function rather than the 1/(1+x) function to remove the processing artefacts caused by the EMAs and the compression within the restricted range. As a result, the RMI is an unbounded centred oscillator, although it is usually at a similar value to the RSI indicator doubled and centred at zero. The bands are intended to make differences between values more visible at a glance and for interface familiarity with the RSI indicator, though their levels are arbitrary and not intended as overbought/oversold signals.
The practical effect of these changes are that divergences are easier to see since the indicator is not compressed at extreme values and divergence strategies based on the RMI indicator are slightly more accurate. The list of occasions on the included DJI Weekly chart where the RMI divergence strategy correctly predicted a reversal while the RSI did not are as follows: July 1932, June 1962, May 1970, November 1987, May 2021
릴리즈 노트
Algorithm is more similar to the ATR algorithm it was inspired by and has an improvement in the way gaps are interpreted.오픈 소스 스크립트
트레이딩뷰의 진정한 정신에 따라, 이 스크립트의 작성자는 이를 오픈소스로 공개하여 트레이더들이 기능을 검토하고 검증할 수 있도록 했습니다. 작성자에게 찬사를 보냅니다! 이 코드는 무료로 사용할 수 있지만, 코드를 재게시하는 경우 하우스 룰이 적용된다는 점을 기억하세요.
면책사항
해당 정보와 게시물은 금융, 투자, 트레이딩 또는 기타 유형의 조언이나 권장 사항으로 간주되지 않으며, 트레이딩뷰에서 제공하거나 보증하는 것이 아닙니다. 자세한 내용은 이용 약관을 참조하세요.
오픈 소스 스크립트
트레이딩뷰의 진정한 정신에 따라, 이 스크립트의 작성자는 이를 오픈소스로 공개하여 트레이더들이 기능을 검토하고 검증할 수 있도록 했습니다. 작성자에게 찬사를 보냅니다! 이 코드는 무료로 사용할 수 있지만, 코드를 재게시하는 경우 하우스 룰이 적용된다는 점을 기억하세요.
면책사항
해당 정보와 게시물은 금융, 투자, 트레이딩 또는 기타 유형의 조언이나 권장 사항으로 간주되지 않으며, 트레이딩뷰에서 제공하거나 보증하는 것이 아닙니다. 자세한 내용은 이용 약관을 참조하세요.