OPEN-SOURCE SCRIPT
IU SIP CALCULATOR
How This Indicator Script Works:
1. This indicator script calculate the monthly SIP returns of any market over any user defined period.
2. SIP stands for Systematic Investment Plan. It is a way to invest in any asset by regularly investing a fixed amount of money at regular intervals for example Monthly, Weekly, Quarterly etc.
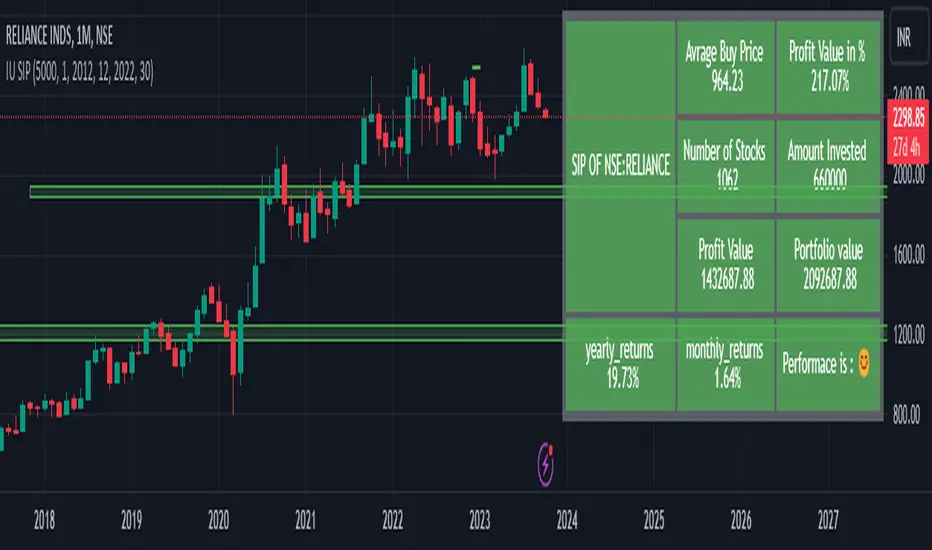
3. This indicator Calculate the following
# Average buy price
# Total quantity hold
# Yearly returns
# Monthly returns
# Total invested amount
# Total profits in amount
# Total portfolio value
# Total returns in per percentage term.
4. This script takes monthly SIP amount, starting month, starting year, ending year, ending month from the user and store the value for calculations.
5. After that it store the open price of every month into an array then it average the array and compare that price with the last month close price.
6. on the bases of this it performs all of the calculations.
7. The script plot every calculation into an table from.
8. It requires monthly chart timeframe for working.
9. The table is editable user can change the color and transparency.
How User Can Benefit From The Script:
1. User can get the past monthly SIP returns of any market he wants to invest this will give him an overview about what to expect from the market.
2. Once user understand the expected returns from the market he can adjust his investment strategy.
3. This help the user to Analyse various stocks and their past performance.
4. User can also short list the best performed stocks.
5. Over all this script will give complete SIP vision of any market.
1. This indicator script calculate the monthly SIP returns of any market over any user defined period.
2. SIP stands for Systematic Investment Plan. It is a way to invest in any asset by regularly investing a fixed amount of money at regular intervals for example Monthly, Weekly, Quarterly etc.
3. This indicator Calculate the following
# Average buy price
# Total quantity hold
# Yearly returns
# Monthly returns
# Total invested amount
# Total profits in amount
# Total portfolio value
# Total returns in per percentage term.
4. This script takes monthly SIP amount, starting month, starting year, ending year, ending month from the user and store the value for calculations.
5. After that it store the open price of every month into an array then it average the array and compare that price with the last month close price.
6. on the bases of this it performs all of the calculations.
7. The script plot every calculation into an table from.
8. It requires monthly chart timeframe for working.
9. The table is editable user can change the color and transparency.
How User Can Benefit From The Script:
1. User can get the past monthly SIP returns of any market he wants to invest this will give him an overview about what to expect from the market.
2. Once user understand the expected returns from the market he can adjust his investment strategy.
3. This help the user to Analyse various stocks and their past performance.
4. User can also short list the best performed stocks.
5. Over all this script will give complete SIP vision of any market.
오픈 소스 스크립트
트레이딩뷰의 진정한 정신에 따라, 이 스크립트의 작성자는 이를 오픈소스로 공개하여 트레이더들이 기능을 검토하고 검증할 수 있도록 했습니다. 작성자에게 찬사를 보냅니다! 이 코드는 무료로 사용할 수 있지만, 코드를 재게시하는 경우 하우스 룰이 적용된다는 점을 기억하세요.
Shivam mandai
면책사항
해당 정보와 게시물은 금융, 투자, 트레이딩 또는 기타 유형의 조언이나 권장 사항으로 간주되지 않으며, 트레이딩뷰에서 제공하거나 보증하는 것이 아닙니다. 자세한 내용은 이용 약관을 참조하세요.
오픈 소스 스크립트
트레이딩뷰의 진정한 정신에 따라, 이 스크립트의 작성자는 이를 오픈소스로 공개하여 트레이더들이 기능을 검토하고 검증할 수 있도록 했습니다. 작성자에게 찬사를 보냅니다! 이 코드는 무료로 사용할 수 있지만, 코드를 재게시하는 경우 하우스 룰이 적용된다는 점을 기억하세요.
Shivam mandai
면책사항
해당 정보와 게시물은 금융, 투자, 트레이딩 또는 기타 유형의 조언이나 권장 사항으로 간주되지 않으며, 트레이딩뷰에서 제공하거나 보증하는 것이 아닙니다. 자세한 내용은 이용 약관을 참조하세요.