OPEN-SOURCE SCRIPT
Z-Score
Description:
The Z-Score indicator is a powerful tool for assessing the relative position of a financial instrument's current price compared to its historical price data. It calculates the Z-Score, which is a statistical measure of how many standard deviations an asset's current price is away from its historical mean. This can help traders identify overbought and oversold conditions in the market.
Input Parameters:
Length: This parameter sets the look-back period for calculating the mean and standard deviation. It is set to 20 by default but can be adjusted according to your trading preferences.
How it works:
The indicator first calculates the mean (average) and standard deviation of the selected price source (default: closing prices) over the specified length.
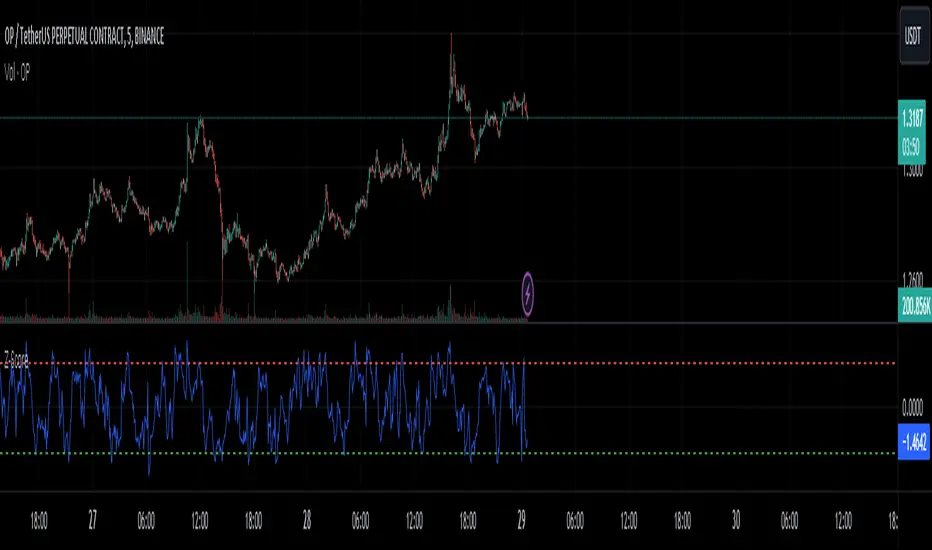
The Z-Score is then computed by measuring how many standard deviations the current price is away from the mean. This value is plotted on the chart, providing insight into the current price's relative position.
Usage:
Overbought: When the Z-Score rises above the upper threshold (e.g., +2 standard deviations, shown in red), it suggests that the asset's price is significantly above its historical average, indicating a potential overbought condition. Traders might consider this as a signal to be cautious about entering long positions or to look for potential short opportunities.
Oversold: Conversely, when the Z-Score falls below the lower threshold (e.g., -2 standard deviations, shown in green), it suggests that the asset's price is significantly below its historical average, indicating a potential oversold condition. Traders might consider this as a signal to be cautious about entering short positions or to look for potential long opportunities.
The Z-Score indicator can be a valuable addition to your technical analysis toolkit, helping you make informed trading decisions based on statistical price deviations.
Please make sure to conduct thorough backtesting and combine this indicator with other analysis techniques before making any trading decisions.
The Z-Score indicator is a powerful tool for assessing the relative position of a financial instrument's current price compared to its historical price data. It calculates the Z-Score, which is a statistical measure of how many standard deviations an asset's current price is away from its historical mean. This can help traders identify overbought and oversold conditions in the market.
Input Parameters:
Length: This parameter sets the look-back period for calculating the mean and standard deviation. It is set to 20 by default but can be adjusted according to your trading preferences.
How it works:
The indicator first calculates the mean (average) and standard deviation of the selected price source (default: closing prices) over the specified length.
The Z-Score is then computed by measuring how many standard deviations the current price is away from the mean. This value is plotted on the chart, providing insight into the current price's relative position.
Usage:
Overbought: When the Z-Score rises above the upper threshold (e.g., +2 standard deviations, shown in red), it suggests that the asset's price is significantly above its historical average, indicating a potential overbought condition. Traders might consider this as a signal to be cautious about entering long positions or to look for potential short opportunities.
Oversold: Conversely, when the Z-Score falls below the lower threshold (e.g., -2 standard deviations, shown in green), it suggests that the asset's price is significantly below its historical average, indicating a potential oversold condition. Traders might consider this as a signal to be cautious about entering short positions or to look for potential long opportunities.
The Z-Score indicator can be a valuable addition to your technical analysis toolkit, helping you make informed trading decisions based on statistical price deviations.
Please make sure to conduct thorough backtesting and combine this indicator with other analysis techniques before making any trading decisions.
오픈 소스 스크립트
트레이딩뷰의 진정한 정신에 따라, 이 스크립트의 작성자는 이를 오픈소스로 공개하여 트레이더들이 기능을 검토하고 검증할 수 있도록 했습니다. 작성자에게 찬사를 보냅니다! 이 코드는 무료로 사용할 수 있지만, 코드를 재게시하는 경우 하우스 룰이 적용된다는 점을 기억하세요.
면책사항
해당 정보와 게시물은 금융, 투자, 트레이딩 또는 기타 유형의 조언이나 권장 사항으로 간주되지 않으며, 트레이딩뷰에서 제공하거나 보증하는 것이 아닙니다. 자세한 내용은 이용 약관을 참조하세요.
오픈 소스 스크립트
트레이딩뷰의 진정한 정신에 따라, 이 스크립트의 작성자는 이를 오픈소스로 공개하여 트레이더들이 기능을 검토하고 검증할 수 있도록 했습니다. 작성자에게 찬사를 보냅니다! 이 코드는 무료로 사용할 수 있지만, 코드를 재게시하는 경우 하우스 룰이 적용된다는 점을 기억하세요.
면책사항
해당 정보와 게시물은 금융, 투자, 트레이딩 또는 기타 유형의 조언이나 권장 사항으로 간주되지 않으며, 트레이딩뷰에서 제공하거나 보증하는 것이 아닙니다. 자세한 내용은 이용 약관을 참조하세요.