OPEN-SOURCE SCRIPT
My Wave
This is my implementation in TradingView of my modified version of the "Weis Wave".
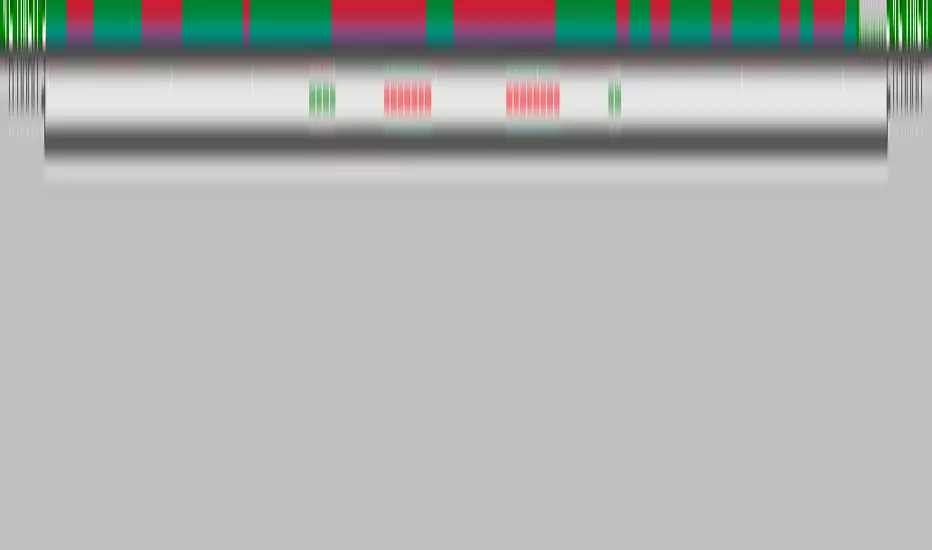
Given the limitations of TradingView in alter past variable values, whenever the close change direction and the wave don't I sum the volume to the present wave and also to a possible future wave.
This results in columns of a mixed color within the columns of the histogram. By changing the percentage input you can and must keep this extra columns to a minimum.
You must insert two copies of the indicator on your chart and "unmerge down" one of them. On the overlayed you must * format and edit and unmark Histup and Histdown, on the unmerged down you must * format and edit and unmark BetaZigZag and stableZigZag.
You can also unmark Bar Color on both if you don't want to colour the bars according to the waves.
Trend: If the buying waves are longer than the selling waves the immediate trend is up, and vice versa.
Look out for a change in trend if in an uptrend the selling waves begin to increase in time and distance or the buying waves shorten, and vice versa.
From the volume histogram you can get the force of the buying and selling waves.
From the price waves you get the result of that force. You can also spot the "shortening of the thrust" up or down.
Comparing the two you can spot "effort without result" "ease of movement".
References: "Trades About To Happen" David H. Weis, Division 2 of the Richard D. Wyckoff Method of Trading in Stocks.
오픈 소스 스크립트
트레이딩뷰의 진정한 정신에 따라, 이 스크립트의 작성자는 이를 오픈소스로 공개하여 트레이더들이 기능을 검토하고 검증할 수 있도록 했습니다. 작성자에게 찬사를 보냅니다! 이 코드는 무료로 사용할 수 있지만, 코드를 재게시하는 경우 하우스 룰이 적용된다는 점을 기억하세요.
면책사항
해당 정보와 게시물은 금융, 투자, 트레이딩 또는 기타 유형의 조언이나 권장 사항으로 간주되지 않으며, 트레이딩뷰에서 제공하거나 보증하는 것이 아닙니다. 자세한 내용은 이용 약관을 참조하세요.
오픈 소스 스크립트
트레이딩뷰의 진정한 정신에 따라, 이 스크립트의 작성자는 이를 오픈소스로 공개하여 트레이더들이 기능을 검토하고 검증할 수 있도록 했습니다. 작성자에게 찬사를 보냅니다! 이 코드는 무료로 사용할 수 있지만, 코드를 재게시하는 경우 하우스 룰이 적용된다는 점을 기억하세요.
면책사항
해당 정보와 게시물은 금융, 투자, 트레이딩 또는 기타 유형의 조언이나 권장 사항으로 간주되지 않으며, 트레이딩뷰에서 제공하거나 보증하는 것이 아닙니다. 자세한 내용은 이용 약관을 참조하세요.