OPEN-SOURCE SCRIPT
업데이트됨 Multi MA MTF SandBox Strategy
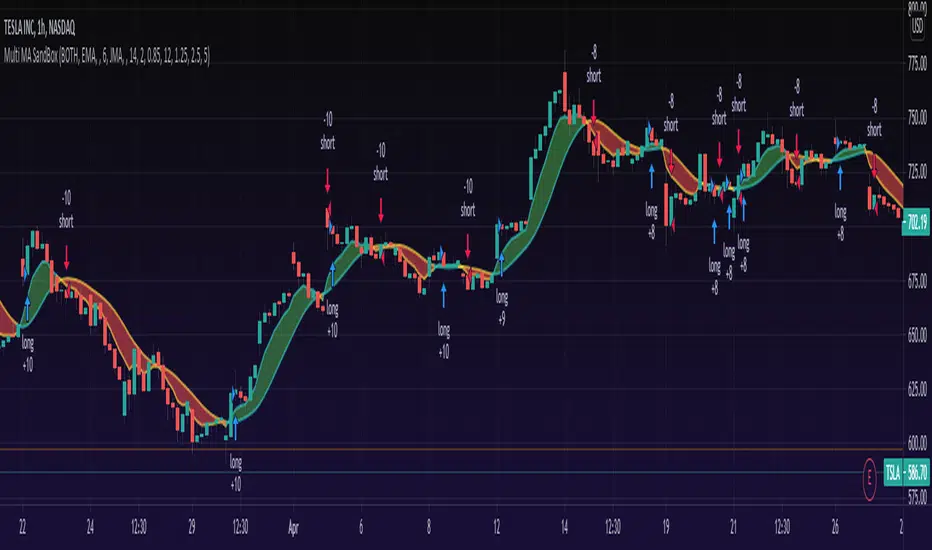
A moving averages SandBox strategy where you can experiment using two different moving averages (like KAMA, ALMA, HMA, JMA, VAMA and more) on different time frames to generate BUY and SELL signals, when they cross.
Great sandbox for experimenting with different moving averages and different time frames.
== How to use ==
We select two types of moving averages on two different time frames (or the same time frame):
First is the FAST moving average that should be at the same time frame or higher.
Second is the SLOW moving average that should be on the same time frame or higher.
== Buy and Sell Signals ==
When FAST moving average cross over the SLOW moving average we have a BUY signal (for LONG)
When FAST moving average cross under the SLOW moving average we have a SELL signal (for SHORT)
WARNING: Using a lower time frame than your chart time frame will result in unrealistic results in your backtesting and bar replay.
== NOTES ==
You can select BOTH, LONG, SHORT or NONE in the strategy settings.
You can also enable Stop Loss and Take Profit.
More sandboxes to come, Follow to get notified.
Like if you like and Enjoy!
Can also act as indicator by setting 'What trades should be taken' to 'NONE':
릴리즈 노트
Updated line colors.릴리즈 노트
Added time range support for strategy.Added line color change support.
Some Cleanup.
릴리즈 노트
Update to pinescript 5Now you can enable stop loss and take profit separately.
Improved text and titles.
Code optimization.
오픈 소스 스크립트
트레이딩뷰의 진정한 정신에 따라, 이 스크립트의 작성자는 이를 오픈소스로 공개하여 트레이더들이 기능을 검토하고 검증할 수 있도록 했습니다. 작성자에게 찬사를 보냅니다! 이 코드는 무료로 사용할 수 있지만, 코드를 재게시하는 경우 하우스 룰이 적용된다는 점을 기억하세요.
Appreciation of my work: paypal.me/dman103
All Premium indicators: algo.win
LIVE Stream - Pivot Points Algo: youtube.com/channel/UCFyqab-i0xb2jf-c18ufH0A/live
All Premium indicators: algo.win
LIVE Stream - Pivot Points Algo: youtube.com/channel/UCFyqab-i0xb2jf-c18ufH0A/live
면책사항
해당 정보와 게시물은 금융, 투자, 트레이딩 또는 기타 유형의 조언이나 권장 사항으로 간주되지 않으며, 트레이딩뷰에서 제공하거나 보증하는 것이 아닙니다. 자세한 내용은 이용 약관을 참조하세요.