OPEN-SOURCE SCRIPT
AlgoPilotX – FibFusion Confluence PRO

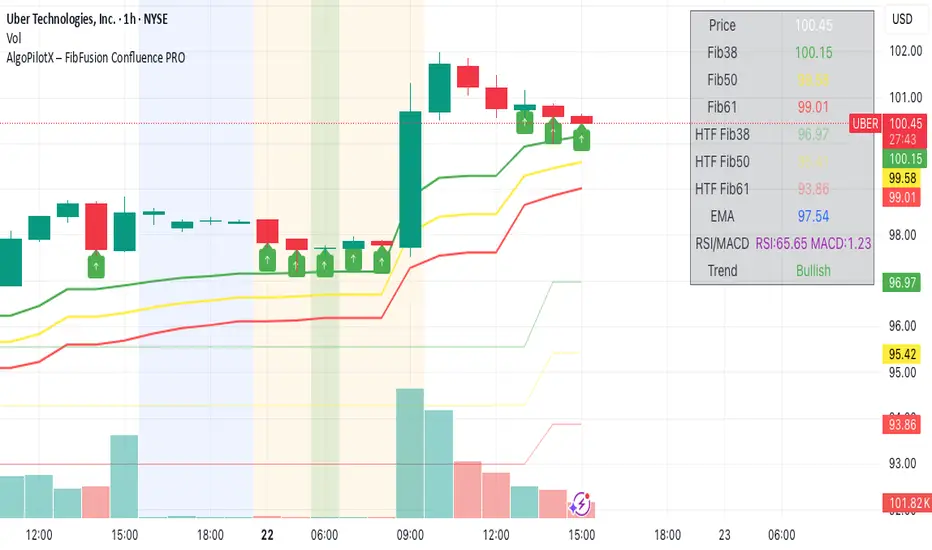
Take your Fibonacci trading to the next level with AlgoPilotX – FibFusion Confluence PRO. This advanced TradingView indicator combines multi-timeframe Fibonacci retracements with key technical indicators to identify high-probability trading zones.
Features:
Detects TF and Higher Timeframe (HTF) Fibonacci levels automatically.
Highlights Fib confluence zones with background colors for bullish and bearish probabilities.
Displays arrows on exact Fib touches for quick visual cues.
Integrated EMA, RSI, and MACD analysis to improve trend accuracy.
Dynamic Trend Indicator: Bullish, Bearish, or Neutral.
Interactive dashboard showing all key levels and indicators in real-time with intuitive color coding.
Supports multiple chart timeframes and recalculates trend and confluence dynamically.
Alerts for high probability bullish or bearish zones, ready to integrate into your trading strategy.
How to Use:
Observe price approaching Fibonacci levels displayed as lines and arrows.
Confluence Zones:
Green background: High-probability bullish zone.
Red background: High-probability bearish zone.
Neutral: No strong confluence.
Confirm signals using EMA, RSI, and MACD.
Use the dashboard to track all key levels, multi-timeframe Fibs, and current Trend.
Enter trades near high-probability confluence zones and manage risk accordingly.
Perfect for swing traders, day traders, and anyone using Fibonacci retracements to find precise entry and exit points.
오픈 소스 스크립트
진정한 트레이딩뷰 정신에 따라 이 스크립트 작성자는 트레이더가 기능을 검토하고 검증할 수 있도록 오픈소스로 공개했습니다. 작성자에게 찬사를 보냅니다! 무료로 사용할 수 있지만 코드를 다시 게시할 경우 하우스 룰이 적용된다는 점을 기억하세요.
면책사항
이 정보와 게시물은 TradingView에서 제공하거나 보증하는 금융, 투자, 거래 또는 기타 유형의 조언이나 권고 사항을 의미하거나 구성하지 않습니다. 자세한 내용은 이용 약관을 참고하세요.
오픈 소스 스크립트
진정한 트레이딩뷰 정신에 따라 이 스크립트 작성자는 트레이더가 기능을 검토하고 검증할 수 있도록 오픈소스로 공개했습니다. 작성자에게 찬사를 보냅니다! 무료로 사용할 수 있지만 코드를 다시 게시할 경우 하우스 룰이 적용된다는 점을 기억하세요.
면책사항
이 정보와 게시물은 TradingView에서 제공하거나 보증하는 금융, 투자, 거래 또는 기타 유형의 조언이나 권고 사항을 의미하거나 구성하지 않습니다. 자세한 내용은 이용 약관을 참고하세요.